
Climate
Heat Deaths Are Rising Across Europe’s Cities, But Not Equally
Heat-related deaths are rising across Europe’s cities, but the burden is uneven. New city-level data reveals sharp increases in heat mortality, intensifying urban heat exposure and growing climate-linked health risks.


In Perpignan, a city on France’s Mediterranean coast, the number of heat-related deaths has risen dramatically. Between 1991–2000 and 2015–2024, the rate increased by 1,184%. Perpignan is not an isolated case. Haskovo in Bulgaria recorded a 697% increase and Castellón de la Plana in Spain 553.5%. In Umeå, Sweden, the increase was 142%. Dublin recorded a 104.6% rise. The numbers come from the first Europe-wide city-level assessment of climate change and health by the Lancet Countdown.
Covering more than 850 cities, the 2026 report shows how differently climate change is being experienced within the same continent. Southern European cities recorded a 160.6% increase in heat-related mortality when 2015–2024 is compared with 1991–2000.
The map of Europe, in other words, does not tell the whole story. The street where a person lives, the amount of shade around them and the heat retained by the buildings around them can all change what a hot summer means. Pierre Masselot, assistant professor in the Environment and Health Modelling Lab at the London School of Hygiene & Tropical Medicine, said the report reinforces evidence that “the health impacts of climate change are increasing faster than our efforts to adapt”.
Heat-related Deaths: Cities Trap Heat for Much Longer
A hot day in a city is not necessarily the same as a hot day outside it. Roads, buildings and other hard surfaces absorb heat during the day and release it slowly. The result is an urban heat island, where temperatures remain higher than in surrounding rural areas. The difference between cities can be striking. Granada experienced temperatures more than 1.5°C above its surrounding rural areas on an average of 118 days each summer between 2003 and 2020. The Spanish urban average was 12.3 days.
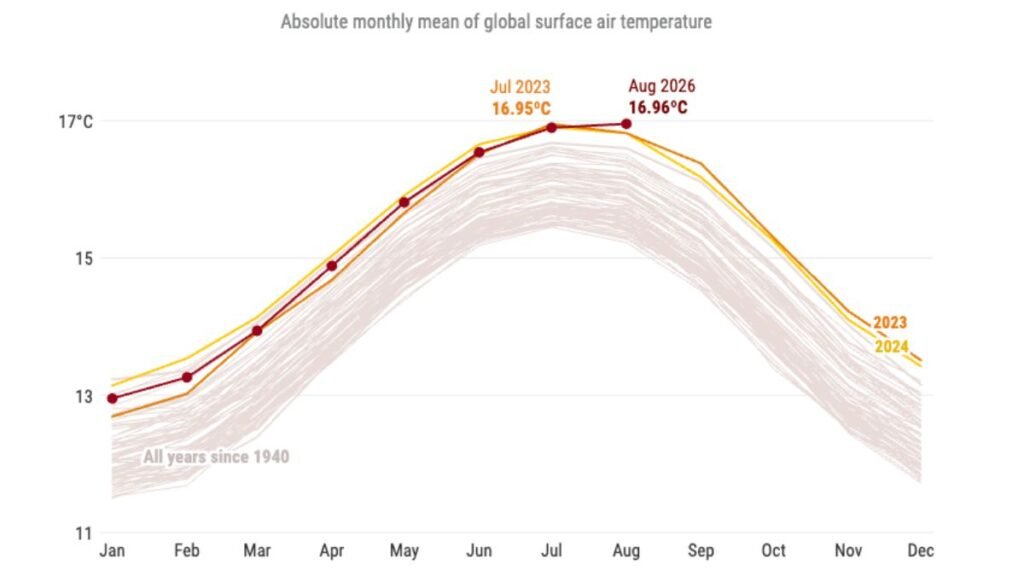
Sofia recorded 109 such days a summer against a Bulgarian urban average of 12.5. In France, Chambéry averaged 90 days, Annecy 78 and Nancy 75, while the national urban average was 12. In Göteborg, the figure was 19.3 days, more than three times Sweden’s urban average of about six. These differences help explain why the health burden of heat cannot be reduced to a European average.
Older people and children are particularly vulnerable. So are outdoor workers and people living in poorer neighbourhoods, where access to shade, cooling and green space may be limited. The report identifies these groups among those facing disproportionate climate-related health risks. For someone working outdoors or an older person living alone, the difference between a city cooling after sunset and one that holds onto the day’s heat can be consequential.
The Heat is Changing More Than Mortality
Heat is the most visible part of the story, but it is not the only one. In eastern European cities, the climatic suitability for dengue transmission increased by 369.3% in 2015–2024 compared with 1982–2010. Pollen concentrations with allergenic potential more than doubled in southern and eastern cities. In southern Europe, wildfire danger increased by 7% between 2003 and 2023.
For doctors, these are not abstract indicators. Miriam Meschede of the Centre for Planetary Health Policy said rising temperatures, worsening wildfire conditions, changing infectious disease risks and greater exposure to pollen are already affecting people’s lives and putting additional pressure on health.
Dr Courtney Howard, an emergency physician and president-elect of the Canadian Medical Association, said more frequent and intense heat, wildfire smoke and changing infectious disease risks can aggravate existing health conditions and contribute to premature deaths. Large-scale extreme events can also put health services under pressure when many people need care at once. That makes the city itself part of the health story. The places where people live, work, travel and seek relief from heat increasingly shape their exposure.
Cleaner Cities, Hotter Summers
There is another side to the European picture, and it complicates any simple account of climate failure. Several countries have made substantial progress in cutting emissions and pollution. Swedish cities reduced greenhouse gas emissions per person by 20% between 2000 and 2024. Residential emissions fell by 78.5% and energy-sector emissions by 62.5%. Premature mortality linked to PM2.5 from dirty-fuel use fell by 68.6% between 2000 and 2023.
France cut city-level greenhouse gas emissions per person by 42.6% over the same broad period, while premature mortality attributable to PM2.5 from power generation fell by 82%. Ireland recorded a 35.3% reduction in city-level emissions per person and a 69% decline in premature mortality attributable to dirty-fuel PM2.5. Those are meaningful public-health gains. Cleaner energy means cleaner air, and cleaner air saves lives.
But the heat numbers keep moving in the other direction. That is the uncomfortable part of the European story. A city can become cleaner without becoming cool enough. Cutting emissions slows the warming that lies ahead; it does not erase the heat already built into the urban environment.
What Happens at Street Level
The report offers some evidence that cities are beginning to respond. Eighty-eight percent of the cities analysed recorded a reduction in summer surface urban heat-island intensity, with an average reduction of 0.7°C. The researchers associate these changes mainly with expanded green space and changes in surface characteristics. But a citywide average can hide a great deal.
A tree-lined street and a heavily built-up neighbourhood may belong to the same municipality while offering very different levels of protection from heat. The same is true of access to public transport, shaded walking routes and places where people can escape extreme temperatures. Masselot argues that cities need to put public health closer to the centre of urban planning, including through greening, cleaner air and stronger protection for vulnerable residents.
Europe has spent years measuring emissions and setting climate targets. The city-level evidence suggests another measure deserves equal attention: what happens to the people living there when the temperature rises. That may be where the success or failure of urban climate policy is ultimately felt.









Climate
India Scores Just 2 Out of 32 for Integrating Health into Climate Commitments
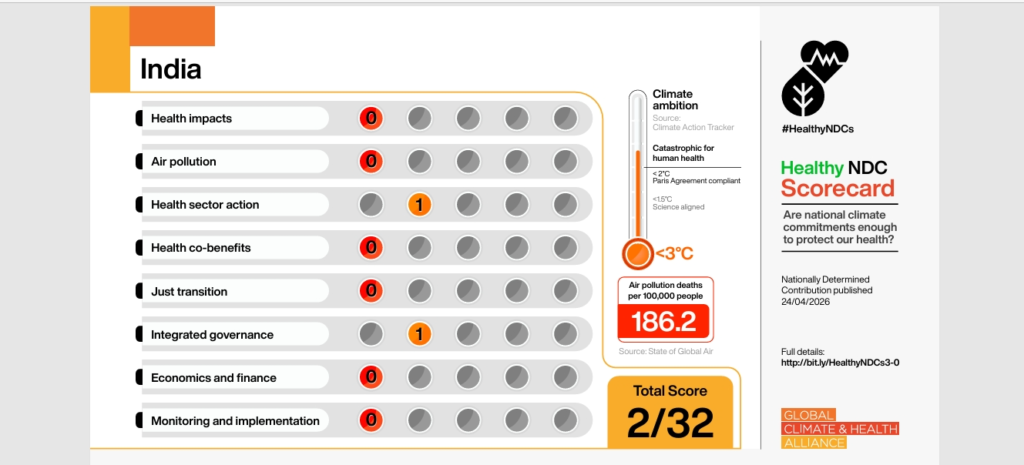
India has scored just 2 out of 32 in a global assessment of how national climate commitments integrate public health. The 2026 Healthy NDC Scorecard highlights gaps in India’s approach to air pollution, climate-related health risks and the implementation of health-focused climate action.


India has scored just two out of a possible 32 points for integrating health into its climate commitments, placing it among the lowest-performing countries in a new global assessment of national climate plans. The findings highlight a significant gap between climate policy and public health in a country grappling with severe air pollution and growing exposure to climate-related hazards.
The Healthy NDC Scorecard, published on October 14 by the Global Climate and Health Alliance (GCHA), assessed the climate plans of 132 countries that submitted their 2035 commitments to the United Nations Framework Convention on Climate Change before August 1, 2026. Nationally Determined Contributions (NDCs) outline the climate actions countries intend to undertake under the Paris Agreement.
India’s score of 2 out of 32 indicates that its latest climate commitment does not adequately recognise the connections between climate change, air quality and human health. Japan and New Zealand received the same score, placing all three among the lowest-scoring countries in the assessment.
The findings are particularly significant for India because the country continues to face a substantial burden of air-pollution-related deaths. The scorecard cites State of Global Air data indicating 186.2 air-pollution deaths per 100,000 people in India, underscoring the scale of the public health challenge.
Health missing from climate planning
The scorecard evaluates national climate commitments across eight categories: health impacts, air pollution, health-sector action, health co-benefits, just transition, integrated governance, economics and finance, and monitoring and implementation.
Each category carries a maximum of four points. Together, they assess whether governments recognise the health consequences of climate change and pollution, outline measures to address them, provide for implementation and monitoring, and connect climate action with wider public health benefits.
India’s scorecard records zero points in six categories: health impacts, air pollution, health-sector action, health co-benefits, just transition, and economics and finance. It receives one point for integrated governance and one for monitoring and implementation.
The assessment also identifies India among the countries that do not refer to air-pollution considerations in their NDCs, despite its high air-pollution mortality burden. The report further states that India’s emissions-reduction targets have been assessed by Climate Action Tracker as not aligned with the Paris Agreement.
These findings suggest that the challenge extends beyond setting emissions targets. Climate commitments also need to address how rising temperatures, deteriorating air quality and extreme weather affect people, and how governments will monitor and finance measures to reduce those risks.
Developing countries lead the rankings
The results show that stronger integration of health into climate planning is possible. Colombia topped the assessment with 29 points, followed by Nigeria with 25 and Cambodia with 24. Paraguay and Timor-Leste completed the top five, scoring 22 points each.
India Scores Just 2 Out of 32 for Integrating Health into Climate Commitments. Image credit:NDC Scorecard
Notably, 19 of the 20 highest-scoring countries were low- and middle-income economies. Colombia’s performance demonstrates how health considerations can be incorporated more comprehensively into national climate commitments.
However, the report cautions against interpreting a higher health score as evidence that a country is doing enough to reduce emissions. Nigeria, for example, combines a high score for health integration with strong climate ambition, while several other high-emitting economies have not matched their attention to health with sufficiently ambitious emissions-reduction targets.
The European Union scored 12, while China, Brazil and the United Kingdom scored nine, seven and nine respectively. The assessment found that these and other major emitters continued to fall short of the emissions reductions needed to protect health.
The findings illustrate two related requirements for effective climate policy: governments must recognise and address the health consequences of climate change, while also reducing emissions sufficiently to limit future warming.
Air pollution offers an immediate opportunity
The GCHA report identifies reductions in short-lived climate pollutants as an opportunity to deliver simultaneous climate and health benefits. These include black carbon, methane, hydrofluorocarbons (HFCs) and tropospheric ozone, which contribute to warming and, in several cases, harm human health through air pollution.
Only five countries — Cambodia, Chile, Colombia, Costa Rica and Paraguay — included targets to reduce black carbon in their climate commitments, according to the assessment.
Reducing these pollutants can slow near-term warming while improving air quality and reducing associated health risks. The report argues that these measures can generate benefits within relatively short periods, alongside the longer-term necessity of cutting carbon dioxide emissions.
For India, the absence of air-pollution considerations from its assessed NDC represents a missed opportunity to connect climate action with an existing public health priority. Integrating air-quality targets into climate planning could help policymakers address pollution and climate risks through a more coordinated approach.
Finance remains a critical challenge
The scorecard also highlights the gap between climate commitments and the resources required to implement them. Citing the latest State of Global Air Quality Funding report, the GCHA says outdoor air-quality funding receives less than one per cent of development funding, despite air pollution’s estimated economic costs amounting to five per cent of global gross domestic product through health impacts, lost productivity and reduced life expectancy.
The report argues that countries need adequate finance to translate national commitments into measures that protect communities. This is especially important for developing economies facing substantial climate risks while having fewer resources to implement adaptation and health-protection measures.
With the 31st United Nations Climate Change Conference (COP31) approaching, the GCHA identifies climate finance as a key issue for international negotiations. It also stresses the importance of maintaining commitments to a just transition away from fossil fuels, which has implications for workers, communities and public health.
For India, the scorecard provides a benchmark against which future climate commitments can be assessed. Its findings point to the need for stronger recognition of health impacts, explicit attention to air pollution, better coordination across sectors, and clearer provisions for financing and monitoring implementation.
The assessment does not measure the full extent of India’s climate or public health policies; it evaluates how health considerations are reflected in the country’s submitted climate commitment. Nevertheless, its central message is clear: climate plans need to do more than promise emissions reductions. They must also demonstrate how climate action will protect people’s health.
Climate
The Monsoon’s New Rhythm: Less Rain, More Intense Downpours
India’s deficient 2026 monsoon highlights the risks of uneven rainfall, from long dry spells to intense downpours, floods and landslides.
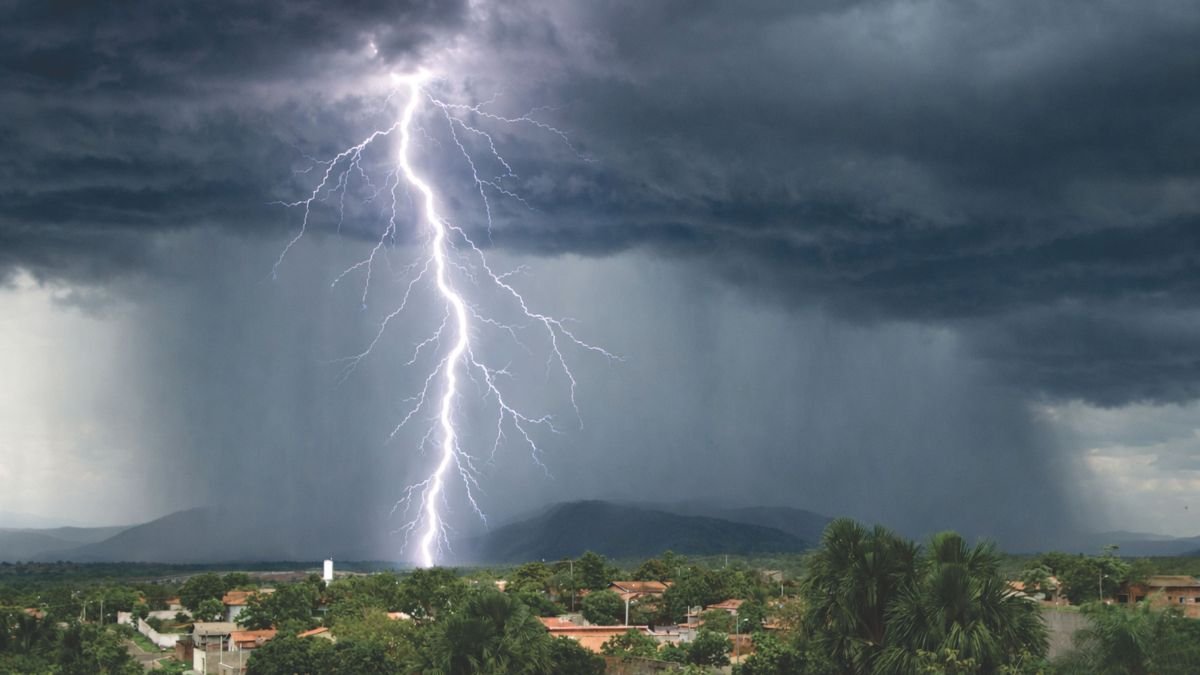
India’s 2026 monsoon ended with a significant rainfall deficit, yet intense downpours continued to cause concern. The changing monsoon pattern raises questions about floods, landslides and how the country prepares for extreme weather. India’s southwest monsoon ended in 2026 with 13% less rainfall than normal, according to the analysis by Climate Trends. Yet a shortage of rain over the season does not mean that every part of the country remained dry. Some places experienced heavy downpours even as others faced long periods without enough rain.
This is one of the challenges of a changing monsoon. Rain may fall heavily within a few hours and then disappear for days or weeks. Such a pattern can leave farmers struggling with dry soil while exposing other areas to sudden floods and landslides. The important question is not simply how much rain India receives each year. It is also how quickly the rain falls, where it falls and how prepared communities are to deal with it.
Less Rain Can Still Mean Floods
Monsoon rainfall is usually measured by comparing the total amount received during the season with the long-term average. This helps scientists understand whether a season has been wetter or drier than normal. But the total does not reveal how the rain was spread across the four months.
Imagine a district that receives most of its seasonal rainfall in just a few days. The total may look reasonable, but the heavy downpours could flood roads, damage homes and wash away crops. The same district could then face several weeks without rain, leaving its fields dry.
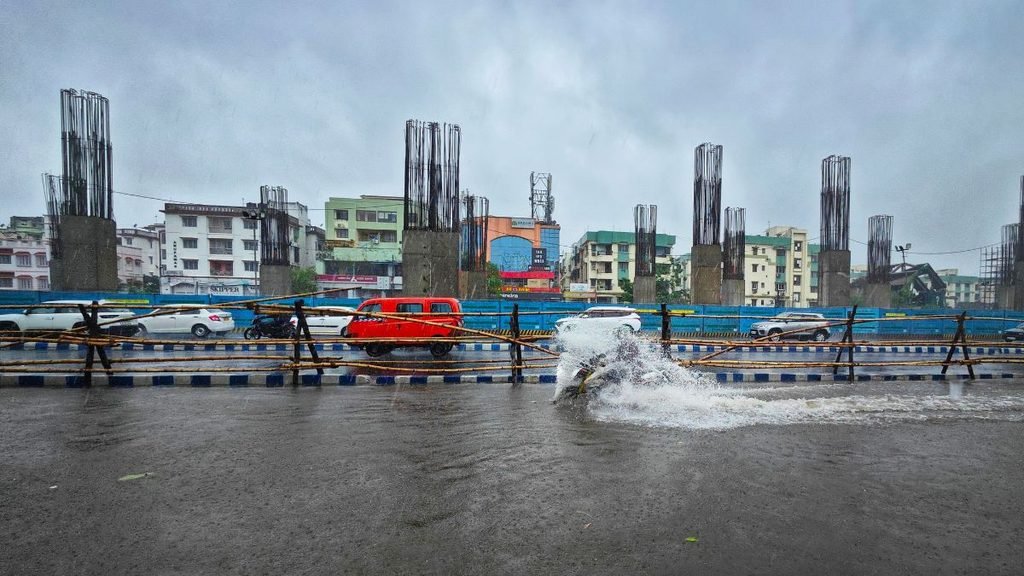
Research shows that rainfall patterns have changed in several parts of India. A study published in npj Climate and Atmospheric Science in 2024 found that short periods of heavy rain had become more frequent in central India in recent decades. It also found an increase in longer spells of heavy rain along the northern west coast. The changes were not the same everywhere, with some regions showing different trends. These findings show why seasonal rainfall figures alone cannot explain the risks people face.
The 2026 monsoon analysis by Climate Trends also points to changes in the way weather systems move across India. Mahesh Palawat, vice-president of meteorology and climate change at Skymet Weather, said low-pressure systems were spending more time over land while retaining their strength. He linked this behaviour to an increase in extreme rainfall events and cloudburst-like conditions. Understanding these changes is important because the effects of a monsoon depend partly on when and where the rain arrives.
Changing Monsoon: Are Cloudbursts Becoming More Common?
The word cloudburst is often used to describe any sudden spell of very heavy rain. However, it has a specific meaning in weather science. The India Meteorological Department defines a cloudburst as rainfall of 100 millimetres or more within one hour over a small area. Such a large amount of rain falling in a short time can quickly flood low-lying areas and trigger landslides, particularly in mountainous regions.
Not every flood or heavy downpour is a cloudburst. Flooding can also happen when rain continues for several hours, rivers overflow or drainage systems fail to carry away the water. Identifying a cloudburst requires rainfall measurements that confirm how much rain fell and how quickly it arrived.
Forecasting these events is difficult because they affect relatively small areas. A weather forecast may warn of heavy rain across a district without identifying the exact village or hillside that will receive the most intense rainfall. Research has found changes in extreme rainfall in parts of India, but this does not establish that cloudbursts are becoming more frequent throughout the country. More detailed records are needed to determine whether the frequency of cloudbursts themselves has increased.
The broader concern is that intense rainfall can cause serious damage, especially where people and infrastructure are exposed to floods and landslides.
How Climate Change Adds to the Risk
A warmer atmosphere can hold more moisture. When weather conditions allow that moisture to form rain, it can contribute to heavier downpours. Climate change does not cause every extreme rainfall event, and the amount of rain produced also depends on wind patterns, local geography and other weather conditions.
The developing El Niño is another factor to watch. This natural climate phenomenon involves warmer-than-usual sea surface temperatures in the tropical Pacific Ocean and can influence India’s monsoon and temperatures. Its effects vary from one event to another.
In the 2026 Climate Trends analysis, climate scientist Roxy Mathew Koll of the Indian Institute of Tropical Meteorology said global warming raises background temperatures and can intensify some of El Niño’s effects. He also highlighted how changes in land use, including deforestation, can worsen local impacts.
Ground Matters as much as the Weather
In hilly areas, heavy rain can soak the soil and make slopes unstable. Cutting into hillsides, removing vegetation and building on vulnerable slopes can increase the danger. When large amounts of rain arrive in a short period, water can rush downhill, carrying soil, rocks and debris with it.
Cities face a different problem. Roads, buildings and paved surfaces prevent much of the rainwater from soaking into the ground. If drains are blocked or too small to carry the water, streets can flood quickly. Building over wetlands and natural waterways also reduces the space available for excess water to flow or collect safely.
These activities do not create a cloudburst. They can, however, make its effects more destructive. Kerala offers an important example. The state recorded a 28% monsoon rainfall deficit in 2026, according to the Climate Trends analysis. Yet its steep Western Ghats slopes, rivers and densely populated areas remain exposed to the dangers of intense rainfall.
A season with less rain overall can still include localised downpours capable of causing serious damage. A rainfall deficit does not remove the risk of floods or landslides.
Beginning with Better warnings
Weather forecasts can help people prepare for heavy rain, but warnings alone cannot prevent disasters. Their effectiveness depends on whether people receive them in time, understand the danger and have a safe place to go.
India needs more reliable rainfall monitoring, particularly in mountain districts, landslide-prone areas and cities that frequently experience flooding. Automatic rain gauges and weather radars can help authorities track how much rain is falling and identify dangerous conditions. These systems also need regular maintenance and timely sharing of information.
Warnings must be useful at the local level. Telling residents that heavy rain is expected across a district may not be enough for people living beside a stream or below an unstable hillside. Local authorities need maps showing which settlements face the greatest risks, along with clear evacuation routes, shelters and plans for moving people to safety.
The way land is used also needs attention. Construction in flood-prone areas and on unstable slopes can expose more people to danger. Protecting wetlands, keeping natural drainage channels clear and preserving vegetation where it helps stabilise slopes can reduce some of the damage caused by heavy rain.
Infrastructure must be able to handle intense downpours. Drains, culverts and bridges need to be assessed against local rainfall conditions, while buildings and roads in vulnerable areas require appropriate flood and slope-risk assessments. Better planning can reduce the likelihood that heavy rain will turn into a disaster.
Preparing for dry spells is equally important. Rainwater harvesting, groundwater management and better soil care can help communities cope when rainfall becomes irregular. Farmers can also improve their resilience by choosing suitable crops and practices that require less water, depending on local conditions.
Planning for Both Floods and Droughts
India depends on the monsoon for farming, drinking water and replenishing rivers and reservoirs. But the seasonal total does not tell the whole story when rainfall is unevenly distributed.
Long dry spells can reduce soil moisture and put pressure on water supplies. Intense downpours can overwhelm drainage systems, damage crops and trigger landslides. Both risks can occur within the same monsoon season. The evidence supports closer monitoring of extreme rainfall and better preparation for its consequences. It does not yet justify claiming that cloudbursts are increasing everywhere in India.
Preparing for this changing pattern requires better weather observations, warnings that reach vulnerable communities, safer construction and protection of natural drainage systems. Water management and agriculture must also account for the possibility of long gaps between rain spells.
No forecasting system can prevent every extreme weather event. But better preparation can help people respond sooner and reduce the damage when intense rain arrives. The challenge is to prepare for the rain India receives, rather than rely only on how much rain the monsoon is expected to bring.
Climate
Heatwaves are Affecting Fertility Traits in Bees.
A new study finds that heatwave exposure during early development can impair fertility-related traits in solitary bees, raising concerns about the potential effects of extreme heat on pollinator populations.
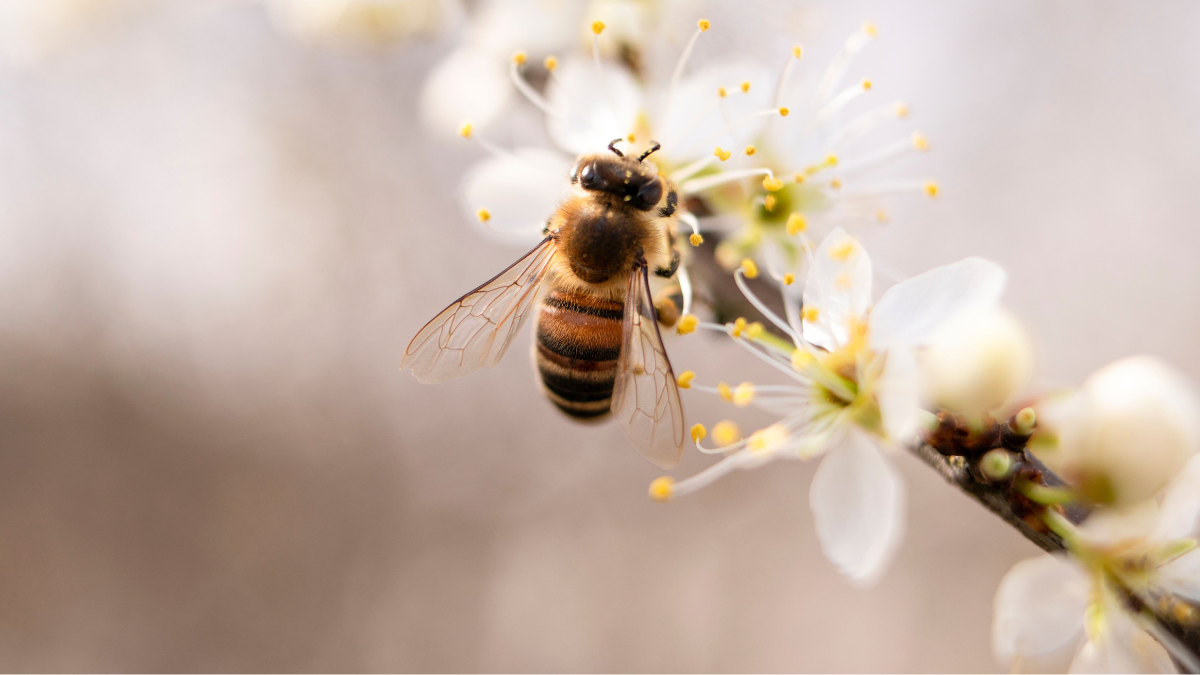
Bees are an attractive species to capture on your mobile phone. They may fit well into the aesthetic imagery of our habitats. But recent studies warn that, in the near future, it might become more convenient to create an AI image of a bee than to spot one in our environment.
There are around 20,400 recorded species of bees in the world. More than 90% do not live in hives or produce honey. This percentage is even higher in India, where, of the approximately 700 bee species, only five are social bees that live in hives and produce honey. The rest are “solitary” bees, with no social hierarchy. These bees live alone, forage and fend for themselves. Moreover, they play an important role in our world.
A new study has reported alarming findings about the fertility traits of these solitary bees. Titled “Lasting impacts of sublethal prepupal heatwaves on fertility-related traits of the solitary bee Osmia bicornis,” the study reveals that simulated sublethal heatwaves during the prepupal stage alter fertility-related traits in solitary bees.
The study investigated the effects of a field-realistic, three-day fluctuating heatwave regime, with temperatures below 40°C and below the critical thermal maximum (CTmax) for this species, replicating the temperature conditions experienced in the UK during July 2022. After the bees overwintered following juvenile exposure, researchers assessed male sperm and female oocytes to examine the effects on reproductive traits.
The study found that, although there was no direct effect on survival to adulthood, male sperm counts were reduced by 33% and sperm motility by 53%, while sperm length was shortened by 17%. In females, oocyte production was reduced by 15%, along with a 17% reduction in terminal oocyte volume.
In bees and many other insect species, testicular development and spermatogenesis usually begin during the prepupal and pupal phases, when the heat stress regime was applied. This period has been found to be thermally sensitive, with heat stress interfering with normal reproductive development. The heatwave simulated in the study may therefore have impaired testicular development and initial sperm production, reducing sperm numbers in adult bees despite the months of overwintering between exposure and assessment.
Reductions in sperm numbers and quality may affect fertilization. Previous research has found that elevated temperatures of 29°C led to decreased sperm abundance, reducing egg fertilization rates and embryo development.
Although this experimental approach does not allow for a detailed exploration of thermal thresholds or breakpoints, it provides valuable insights into the potential biological consequences of ecologically realistic, fluctuating heat stress, as experienced during heatwaves in nature.
Solitary bees are crucial to the pollination of several crops, including cucurbits, blueberries, cranberries, tomatoes, eggplants, apples, plums and almonds, as well as various lentils and other crops. These bees are efficient pollinators because they carry dry pollen across their bodies, potentially making them more effective than honeybees for certain crops.
This is not an isolated area of research. Another study published in 2023 also examined the damaging effects of heat on sperm production in bees, focusing on bumblebees of the genus Bombus.The study found that exposing whole male bumblebees to 4°C for 85 minutes, isolated seminal vesicles to 4°C for 85 minutes ,and whole males to 4°C for 48 hours did not significantly affect sperm viability.
However, after 85 minutes at 45°C, males showed significantly reduced sperm viability. This suggests that short-term heatwaves below the critical thermal maximum could substantially reduce male bumblebee fertility, with potential population-level consequences.
The thermal tolerance of worker bumblebees is relatively high, with a CTmax of approximately 48–55°C, making it unlikely that they would experience these temperatures under ordinary conditions, even with climate warming. However, the thermal tolerance of whole organisms often exceeds that of their reproductive cells. Many insects can be sterilised by exposure to temperatures well below their upper thermal tolerance.
Why Should This Matter?
Pollination, a crucial process for maintaining the planet’s biodiversity and food security, is primarily driven by bees and other insect pollinators.
In agricultural systems, pollinators are essential for producing a wide range of crops, including orchard fruits, horticultural crops and forage, as well as seeds for root and fibre crops. Pollinators contribute to approximately 35% of global crop production by volume, enhancing the yields of 87 of the 115 major food crops and numerous medicinal plants.(FOA data)

Bees pollinating on a flower.Image credit:Pexels
The benefits of pollination extend beyond improving the quantity and quality of food production. Pollinator-dependent plants contribute to the production of many micronutrients and vitamins that are important for human nutrition and dietary diversity.
The Food and Agriculture Organization (FAO) also points out that more than 80% of wild flowering plant species are pollinated by animals, mostly insects.
Bees and other pollinators face significant threats, with current extinction rates estimated to be 100 to 1,000 times higher than natural background rates due to human activities. According to the International Union for Conservation of Nature (IUCN), national Red List assessments indicate that around 40% of bee species assessed in some regions are at risk of extinction, while 16.5% of vertebrate pollinators are at risk of global extinction.
Habitat loss and fragmentation, intensive farming, monocultures, pesticides, pests, diseases and climate change-related impacts, such as temperature extremes and shifts in flowering times, are major contributing factors to pollinator decline. These pressures can disrupt the balance between flowering plants and their pollinators.
To establish whether the observed reproductive changes translate into fewer offspring, declining populations or substantially reduced pollination under real-world conditions, further research and evidence are needed. However, habitat fragmentation, climate change, extreme heat and biodiversity loss are already placing increasing pressure on ecosystems. Understanding how these stressors affect the reproductive capacity of bees is therefore essential to assessing the potential long-term consequences for biodiversity and food security.


How Scientists Traced the Flow of Matter Around a Dead Star Using X-rays

India Scores Just 2 Out of 32 for Integrating Health into Climate Commitments

Global Job Market Faces a Growing Inclusion Gap as AI and Digitalisation Reshape Work

FSSAI Moves to Restrict Added Sugars in Infant Foods, Citing Need for Stronger Nutritional Safeguards

NMC Directs Medical Colleges to Set Up Patient Safety Committees

From Scams to Screens: How the National Stock Exchange Rewrote India’s Equity Story

Knowing When to Think for Ourselves: AI, Intuition and the Education of Discernment

After a Scorching Summer, Delhi’s Children Are Slow to Return Outdoors

Two Chemists Win Nobel Prize for Solving a Century-Old Puzzle: Why Life Picks One Hand Over the Other

India’s AI Moment Rests on More Than Code

-

 Math3 months ago
The 2026 Fields Medals: Four Proofs, Four Decades-Old Problems Solved
-
EP Deep Dive: Data & Solutions3 months ago
After Kerala’s Deadliest Landslide, the Hardest Thing to Rebuild Was Childhood
-
EP Deep Dive: Data & Solutions4 months ago
West Asia Crisis: Can Kerala’s Returning Gulf Migrants Find a Future in the Green Economy?
-
Space & Physics5 months ago
India Semiconductor Mission: ‘It’s Not About Fabs. It’s About Building An Entire Ecosystem’
-
Interviews4 weeks ago
From Scams to Screens: How the National Stock Exchange Rewrote India’s Equity Story
-
Climate5 months ago
The Climate World Cup? How Climate Change Could Affect Player Performance at the 2026 World Cup
-
Society3 months ago
What Is Civilisational Diplomacy? Understanding India’s Newest Foreign Policy Tool
-
Society4 months ago
From Bell Labs to the Classroom: A Second Career in Teaching