
Climate
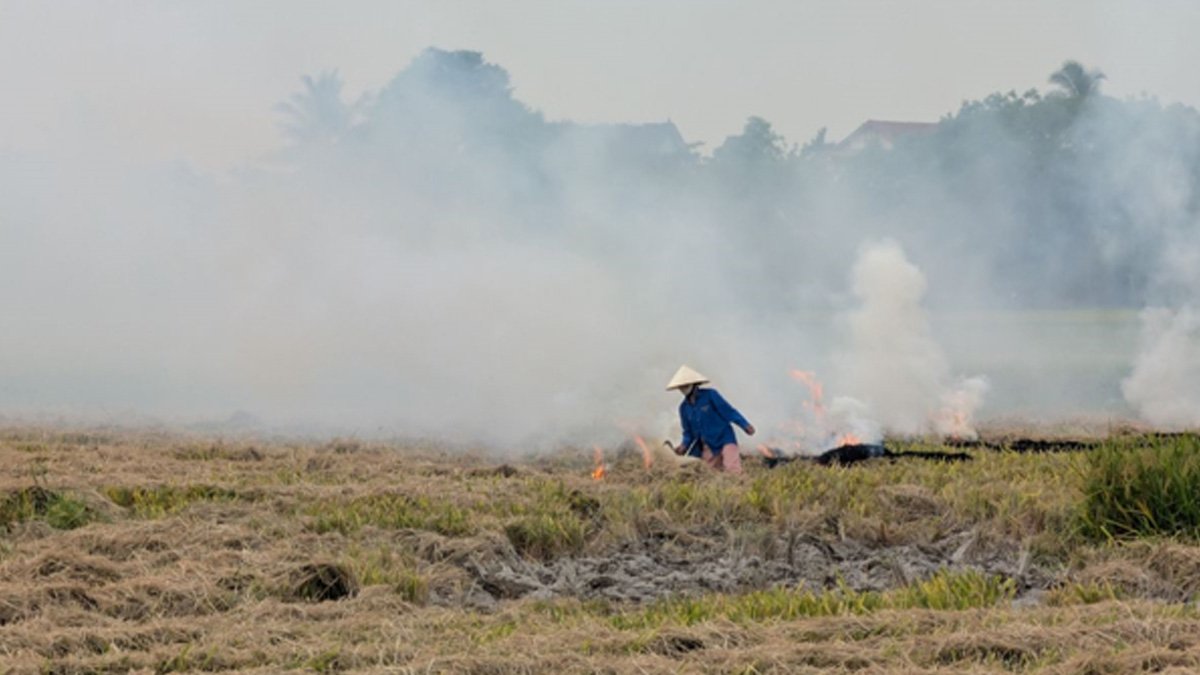
Delhi’s Air Quality Paradox: Lower Average, Higher Everyday Pollution
Delhi’s average AQI fell by 15.8 per cent in 2026, but its median AQI rose by 14.1 per cent. A new assessment examines what these contrasting numbers reveal about the city’s everyday pollution.










Earth
252 Million Hectares Under Restoration Across 149 Countries, but UN Warns of 2030 Target Gap
A UN report finds that 252 million hectares across 149 countries are under ecosystem restoration. However, increased investment and accelerated action are needed to meet global restoration targets by 2030.

Global efforts to restore degraded ecosystems have reached 252 million hectares across 149 countries, generating more than one million green jobs. However, a new United Nations assessment warns that restoration efforts remain insufficient to meet international biodiversity targets by 2030, calling for a more than fourfold increase in annual investment.
The findings are presented in the Restoration Progress Report: Nature’s Comeback – Scaling Ecosystem Restoration for People and Planet, released on October 29, 2026, by the United Nations Environment Programme (UNEP), the Food and Agriculture Organization (FAO) and the Secretariat of the Convention on Biological Diversity (CBD).
The report provides the first comprehensive global assessment of progress towards commitments to restore approximately one billion hectares of degraded ecosystems. These commitments are linked to the UN Decade on Ecosystem Restoration (2021–2030) and the Kunming-Montreal Global Biodiversity Framework, which calls for at least 30 per cent of degraded terrestrial, freshwater, marine and coastal ecosystems to be under effective restoration by 2030.
According to the assessment, the 252 million hectares currently documented under restoration represent the largest recorded global restoration effort. However, this accounts for only 34 per cent of the indicative global benchmark associated with the 2030 target.
Freshwater and marine ecosystems lag behind
The report identifies considerable differences in restoration progress across regions and ecosystem types. Asia accounts for the largest share of documented restoration, with 192.2 million hectares, followed by Africa with 36.3 million hectares and Europe with 9.1 million hectares. North and Central America account for 5.8 million hectares, South America 5.4 million hectares and Oceania 3.2 million hectares.
However, the report cautions that these figures should not be interpreted as a ranking of restoration performance, as they also reflect differences in regional land area and monitoring and reporting capacities.
Restoration of terrestrial ecosystems has reached nearly half of the global 2030 target. China reports the largest terrestrial restoration area, with 127.4 million hectares, while substantial restoration activities have also been documented in Mongolia and Kazakhstan.
Progress remains considerably slower in freshwater, marine and coastal ecosystems, despite these environments experiencing rapid degradation.

A river along the side of a dense forest. Image credit: Pexels
The assessment documents 11 million hectares of freshwater ecosystems under restoration across 62 countries and 5.7 million hectares of marine and coastal ecosystems across 46 countries. The report also notes that limited monitoring and reporting may mean that actual restoration activities in these ecosystems are higher than the documented figures.
Meanwhile, the share of countries reporting implemented wetland restoration or rehabilitation programmes has increased from 8 per cent in 2022 to 54 per cent.
Restoration financing needs to increase fourfold
Insufficient investment remains a major obstacle to achieving global restoration commitments. The report estimates that annual restoration financing must increase from US$64 billion to US$296 billion by 2030, representing more than a fourfold rise.
Agroforestry requires the largest estimated annual investment, at US$87 billion, followed by restorative reforestation at US$52 billion, peatland restoration at US$44 billion and seagrass restoration at US$28 billion.
The report identifies employment generation as another potential benefit of scaling up restoration. While more than one million green jobs have already been associated with restoration initiatives, increased global investment could generate up to 32 million additional jobs by 2030.
It also highlights the potential contribution of ecosystem restoration to climate mitigation and biodiversity protection. Research cited in the assessment indicates that restoring just 15 per cent of global priority areas could capture and store 30 per cent of carbon dioxide-equivalent emissions released since the Industrial Revolution and help prevent 60 per cent of projected species extinctions.
The report further identifies the participation and leadership of Indigenous Peoples and local communities as essential to ensuring long-term restoration outcomes. Secure land rights, stronger monitoring systems and sustained political commitment are among the priorities identified.
With five years remaining in the UN Decade on Ecosystem Restoration, the assessment calls on governments to move beyond isolated restoration projects towards coordinated, long-term programmes that address the underlying causes of ecosystem degradation.
It emphasises that the 2030 targets should serve as a milestone in the restoration process rather than its conclusion, as ecological recovery requires sustained action and investment beyond the end of the decade.
Climate
El Niño Could Help Forecast India’s Humid-Heat Risks Six Months Ahead, Study Finds
New research suggests that El Niño and other tropical climate signals could help forecast India’s humid-heat risks and potential labour productivity losses up to six months in advance, offering more time to protect outdoor workers.
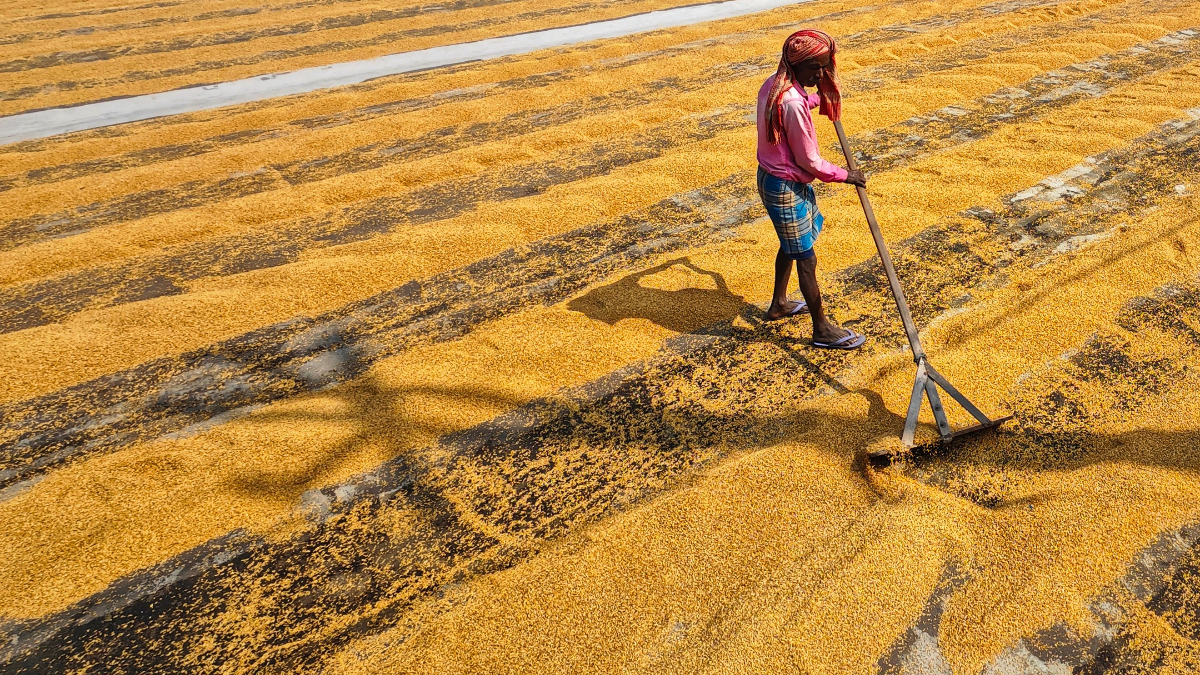
India could gain up to six months to prepare for the risks of extreme humid heat, as researchers have identified a link between El Niño and heat-related losses in working capacity. The findings could help authorities strengthen heat action plans, prepare health services and protect workers in agriculture, construction and other outdoor occupations.
The study, published in the Journal of Geophysical Research: Atmospheres in July 2026, found that the El Niño–Southern Oscillation (ENSO), a climate pattern involving changes in tropical Pacific Ocean temperatures and atmospheric circulation, is strongly associated with year-to-year variations in potential productivity losses caused by humid heat. The research, led by researchers at the Indian Institute of Tropical Meteorology (IITM), Pune, suggests that these losses could be predicted up to six months in advance.
According to a report published by Nature India on October 28, the researchers analysed historical climate and population data from 1950 to 2020, using heat-stress measures including Humidex and wet-bulb globe temperature (WBGT). Their analysis found that tropical Indo-Pacific ocean temperatures could explain approximately 42% of the variation in India’s potential productivity losses associated with humid heat.
The findings offer a possible early-warning tool for a country where millions of people work outdoors and exposure to high temperatures can threaten both their health and livelihoods.
Rising heat stress and its economic consequences
The study found that global potential productivity losses associated with Humidex values exceeding 45°C increased approximately 18-fold between 1950–1954 and 2016–2020. India’s estimated losses rose around 23-fold over the same period, accounting for more than half of the global increase.
Researchers attributed the rise in India to climate change and population growth, which contributed almost equally to the increase. Even if population had remained constant, climate change alone would have driven a four-to-fivefold increase in potential productivity losses, the study found.
The researchers also identified a faster rise in humid-heat risks from the mid-1980s, coinciding with average sea-surface temperatures in the Indo-Pacific warm pool crossing 28°C.
The findings are particularly relevant to India’s informal workforce, where outdoor workers often have limited opportunities to avoid heat exposure without losing income.
A separate study published in Scientific Reports in March 2026 examined heat stress among 1,560 outdoor workers across 11 districts of Tamil Nadu. Researchers found that WBGT measurements exceeded the critical threshold of 30°C. Workers exposed to elevated heat stress had 1.4 times the risk of reporting productivity losses compared with those without such exposure.
The study also found that 15% of surveyed workers reported losing daily wages because of heat during summer. The findings provide region-specific evidence of how rising temperatures can affect both working capacity and household incomes.
Turning forecasts into worker protection
The new research could help authorities move beyond responding to heatwaves after they develop. Longer-range risk estimates could give health departments time to review heatstroke treatment capacity, disaster-management agencies time to prepare resources, and labour departments time to plan protective measures for outdoor workers.
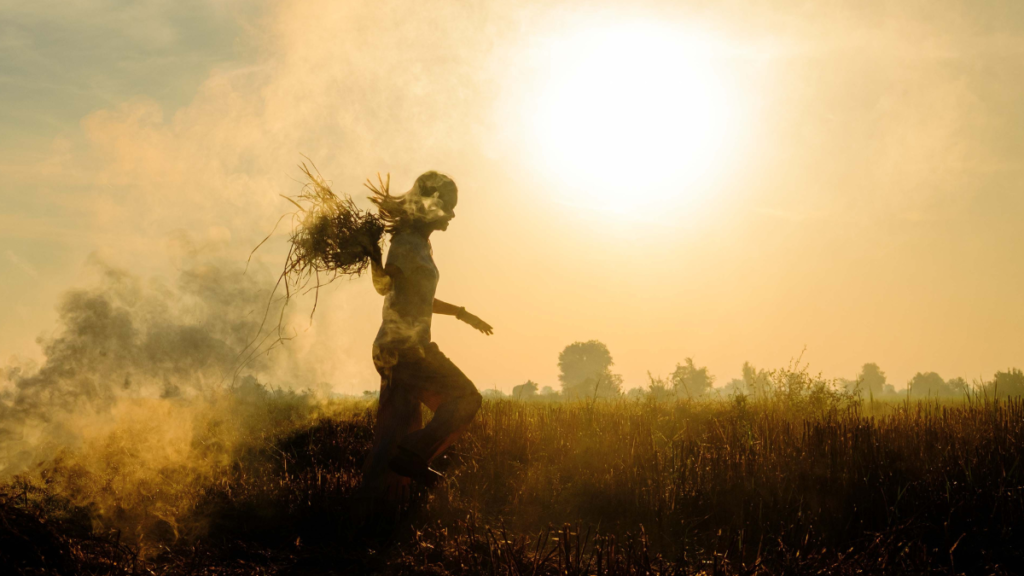
Silhoutte of a farmer working in a hot summer.Image credit:Pexels
India already issues seasonal temperature and heatwave outlooks, alongside shorter-range heat-index forecasts. Integrating longer-range climate signals with these systems could strengthen preparedness, provided the forecasts are tested and translated into practical protocols.
However, the researchers and climate experts caution that predictability does not eliminate uncertainty. India’s weather is influenced by several interacting oceanic and atmospheric systems, and El Niño does not produce identical rainfall or temperature outcomes every year.
The term “super El Niño” also has no formally defined category under the India Meteorological Department or the World Meteorological Organization. In a July 2026 parliamentary response, the Ministry of Earth Sciences said El Niño conditions could strengthen during October–December, potentially reaching the very strong category, while noting that regional impacts depend on several factors.
The central challenge, therefore, is to ensure that improved climate information leads to timely action. Forecasts must be combined with local weather observations, workplace conditions and workers’ experiences to identify those facing the greatest risks.
As humid heat intensifies, advance warning could become an important tool for reducing avoidable health and economic losses. But its effectiveness will depend on whether governments and employers can turn that warning into safer working conditions without forcing vulnerable workers to choose between their health and their income.
Climate
Cyclone Arnab Makes Landfall in Andhra Pradesh, Uproots Trees and Disrupts Power Supply
Cyclone Arnab hits Andhra Pradesh with strong winds and heavy rainfall, disrupting transport and electricity supply as authorities evacuate vulnerable coastal communities.
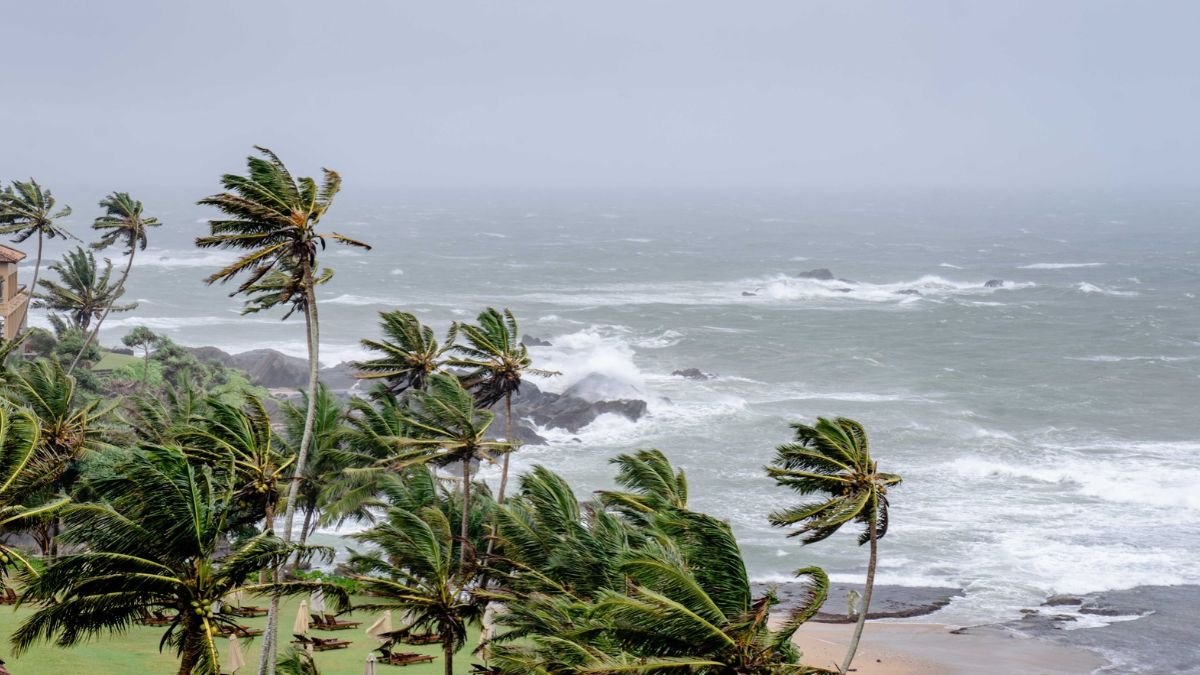
Cyclone Arnab crossed the Andhra Pradesh coast in the early hours of Wednesday, October 28, bringing destructive winds and heavy rainfall to coastal districts. Trees were uprooted, electricity infrastructure was damaged and transport services were disrupted as authorities continued emergency operations in vulnerable areas. The last major cyclone to hit Andhra Pradesh before Cyclone Arnab was Cyclone Montha, which made landfall near Kakinada on October 28–29, 2025. It struck almost exactly a year before Arnab’s landfall on October 28, 2026.
The India Meteorological Department (IMD) had forecast that the very severe cyclonic storm would cross the Andhra Pradesh–Yanam coast between Bapatla and Visakhapatnam, close to Yanam, with sustained winds of 125–135 kmph and gusts reaching 150 kmph. The landfall process began early on Wednesday and was expected to continue for several hours.
Officials reported peak winds of up to 185 kmph during the storm, while warning that dangerous weather would persist across coastal Andhra Pradesh and parts of neighbouring Odisha even as the system weakened over land. The IMD’s subsequent bulletins will be important for establishing the storm’s observed intensity and movement.
What Does the Name Arnab Mean?
The name Arnab was proposed by Bangladesh and is included in the official list of tropical cyclone names maintained under the World Meteorological Organization (WMO) and the United Nations Economic and Social Commission for Asia and the Pacific (UN ESCAP) regional system.
Pronounced “Ornab”, the name is commonly associated with the Bengali word for the ocean or sea. The official naming list confirms Bangladesh as the country that proposed it, although the list itself does not provide a formal definition of the word.
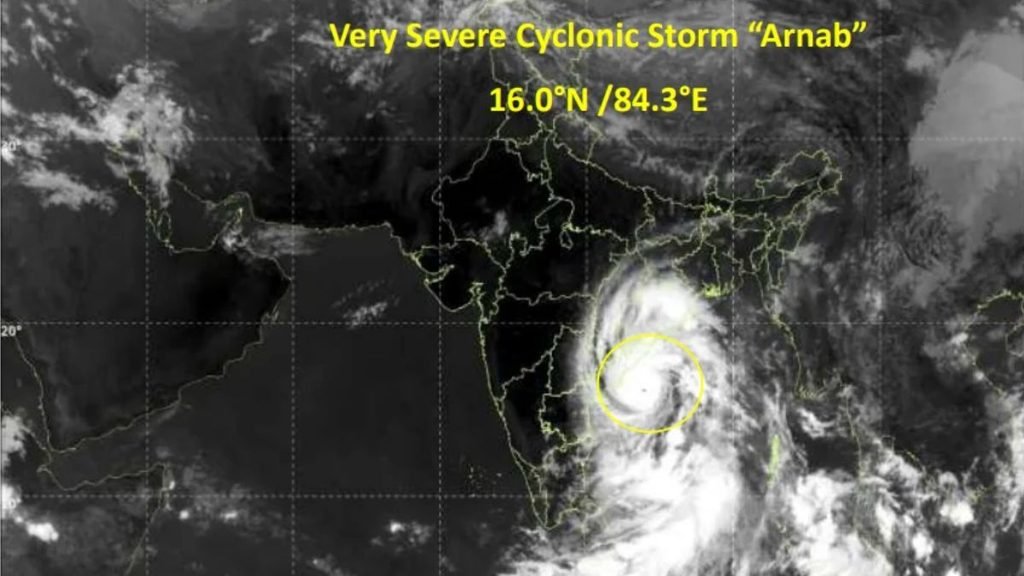
The regional naming system includes 13 countries: Bangladesh, India, Iran, the Maldives, Myanmar, Oman, Pakistan, Qatar, Saudi Arabia, Sri Lanka, Thailand, the United Arab Emirates and Yemen. Each country contributes names to a shared list, which meteorological agencies use in sequence as cyclones develop over the Arabian Sea and Bay of Bengal.
Andhra Pradesh Bears the Immediate Impact
Coastal Andhra Pradesh experienced the most immediate effects as the cyclone approached and crossed the coast. Reports from Kakinada described uprooted trees and damaged electrical infrastructure. In Visakhapatnam, strong winds and rain brought down trees, obstructing traffic along Beach Road and in Seethammadhara.
The IMD reported exceptionally heavy rainfall at several locations in Anakapalli and Visakhapatnam districts. Rainfall exceeding 200 mm was recorded at some stations during the observation period extending from October 27 into the early hours of October 28. Such intense rainfall can overwhelm drainage systems, flood low-lying settlements and disrupt road connectivity.
Power disruptions and transport cancellations added to the difficulties faced by residents. Some train services were cancelled, while flight operations at airports in the region were reported suspended. Schools were closed in affected areas, and some school buildings were used as temporary shelters. The full extent of damage to houses, agricultural land, roads and public infrastructure was not yet clear in the initial post-landfall reports.
Thousands Evacuated: Authorities Prepare for Flooding
The scale of the evacuation operation reflected the exposure of coastal communities to strong winds and flooding. According to the Associated Press, at least 89,000 people had been evacuated from vulnerable areas in Andhra Pradesh by Wednesday morning.
Authorities had established more than 2,000 cyclone shelters across 20 districts, secured over 30,000 fishing boats and deployed nearly 1,100 medical teams for emergency assistance. The state’s disaster management authority said more than 12 million people lived along the cyclone’s projected path.
In neighbouring Odisha, authorities planned to evacuate approximately 48,000 people from areas expected to be affected. The IMD warned of heavy to extremely heavy rainfall in parts of southern Odisha, raising concerns about flooding and possible landslides in hilly districts. The evacuation figures describe the scale of preparedness and displacement, rather than the number of people confirmed to have suffered damage or injury.
Risks Continue After Landfall
A cyclone’s impact can persist after its centre crosses the coast. Heavy rainfall may continue as the system moves inland, while saturated soil and swollen rivers can increase flood risks. Strong winds can also delay the restoration of electricity and transport services.
Agriculture and fishing are among the livelihoods potentially exposed to the storm. Standing paddy crops may be damaged by strong winds and waterlogging, while rough seas and fishing restrictions can interrupt incomes for coastal communities. The actual losses to these sectors will depend on the storm’s subsequent movement and local damage assessments. At the time of the initial post-landfall reports, there were no immediate reports of casualties. This was an early assessment, and the situation required continued monitoring as emergency teams reached affected areas.


Delhi’s Air Quality Paradox: Lower Average, Higher Everyday Pollution

Lesser Florican, Bengal Florican Top India’s Priority List for Bird Conservation, Study Finds

252 Million Hectares Under Restoration Across 149 Countries, but UN Warns of 2030 Target Gap

El Niño Could Help Forecast India’s Humid-Heat Risks Six Months Ahead, Study Finds

MIT Researchers Develop Origami-Based Method for Lightweight, Load-Bearing Structures

Knowing When to Think for Ourselves: AI, Intuition and the Education of Discernment

After a Scorching Summer, Delhi’s Children Are Slow to Return Outdoors

Two Chemists Win Nobel Prize for Solving a Century-Old Puzzle: Why Life Picks One Hand Over the Other

Marshall Islands: Why the US Nuclear Legacy Is Back Before the UN

Climate Change, Overfishing and the Uncertain Future of Bangladesh’s Hilsa Fishermen

-

 Math3 months ago
The 2026 Fields Medals: Four Proofs, Four Decades-Old Problems Solved
-
EP Deep Dive: Data & Solutions3 months ago
After Kerala’s Deadliest Landslide, the Hardest Thing to Rebuild Was Childhood
-
EP Deep Dive: Data & Solutions4 months ago
West Asia Crisis: Can Kerala’s Returning Gulf Migrants Find a Future in the Green Economy?
-
Space & Physics5 months ago
India Semiconductor Mission: ‘It’s Not About Fabs. It’s About Building An Entire Ecosystem’
-
Interviews1 month ago
From Scams to Screens: How the National Stock Exchange Rewrote India’s Equity Story
-
Climate5 months ago
The Climate World Cup? How Climate Change Could Affect Player Performance at the 2026 World Cup
-
Society4 months ago
What Is Civilisational Diplomacy? Understanding India’s Newest Foreign Policy Tool
-
Society5 months ago
From Bell Labs to the Classroom: A Second Career in Teaching