Connect with us

Climate

India tops the world for population exposed to climate-driven risky heat

Climate-driven heat exposed 117 million people in India to a month or more of risky heat between June and August 2026, Climate Central found.


Published

on

climate-driven heat
A woman shields herself from the summer heat on a busy street in India.. Image credit: Anurag Jamwal/Pexels

Climate-driven heat exposed 117 million people in India to a month or more of risky heat between June and August 2026, according to a Climate Central analysis.

Between June and August this year, 117 million people in India spent a month or more under heat that would have been far less likely without a warming planet. That single number, from a new global analysis by Climate Central, puts India at the top of the world’s list for population exposed to climate-driven risky heat — ahead of China’s 94 million and Indonesia’s 83 million.

The finding sits inside a larger, starker pattern. Worldwide, over 1.5 billion people experienced 30 or more days of risky heat that climate change made significantly more likely this summer. On any single day of the season, more than a quarter of humanity felt a strong climate change signal in the local temperature. Climate Central’s scientists tracked this using their Climate Shift Index (CSI), which measures how much more likely a given day’s warmth was because of climate change, and flagged “risky heat days” as those hotter than 90% of what a place recorded between 1991 and 2020 — the threshold at which heat starts to strain the body.

The Global Climate-Driven Heat Scoreboard

Europe came out the most unusually hot continent on the planet this year, even though it was not the most populous one affected. Eighty-nine per cent of Europeans — nearly nine in ten — spent a month or more under risky heat. France and the Holy See tied for the largest temperature anomaly of any country, running 3.5°C above their historical norm, and seven of the world’s ten most abnormally hot countries were European. Fifty-four countries recorded their hottest June-to-August since 1970, France, Italy and the United Kingdom among them.

Asia, by contrast, carried the largest raw number of people through this heat: 2.8 billion, or 58% of the continent’s population, spent 30 days or more under conditions strongly shaped by climate change. India and Egypt were the two countries where more than 100 million people each crossed that threshold.

Africa’s story shows up less in totals and more in persistence. Six African countries spent at least 95% of the entire three-month period under a strong climate change influence — Rwanda for 91 days, Uganda for 89, Ethiopia for 88. For those populations, the season did not have an unusually hot patch; nearly the whole summer was one.

In North America, four in five people in the United States lived through a month’s worth of risky summer heat, with the average American gaining 23 such days from climate change and the average Canadian gaining 17.

India’s numbers, city by city

Nationally, India ran 0.7°C warmer than its 1991–2020 June-to-August average, and the average Indian experienced climate change’s fingerprint on local temperature for 39 days across the three months — better than a third of the entire season.

City-level data obtained alongside the release shows how unevenly that heat landed.

CityStateDays with strong climate signalRisky heat daysRisky heat days added by climate change
MumbaiMaharashtra86244
PuneMaharashtra761717
SuratGujarat74269
BengaluruKarnataka7300
MaduraiTamil Nadu702323
NashikMaharashtra672019
CoimbatoreTamil Nadu6600
VisakhapatnamAndhra Pradesh65219
TiruchirappalliTamil Nadu642929
ChennaiTamil Nadu604030
VijayawadaAndhra Pradesh431810
SrinagarJammu and Kashmir285329

Source: Climate Central, June–August 2026 city dataset.

Two different stories run through these columns, and conflating them misses the point.

Mumbai tops the country for sheer duration: 86 of the 92 days in the season carried a strong climate change signal, more than any other Indian city measured. But of Mumbai’s 24 risky heat days, only four were added by climate change — the city runs hot most of the year regardless, so the climate contribution to its worst days is comparatively small. Pune and Nashik, sitting in Mumbai’s own state, show almost the opposite ratio: nearly every risky heat day they had this summer would not have happened without climate change.

Chennai had both the most risky heat days in the country — 40 — and the most added by climate change — 30. That combination makes it the city where the analysis draws the clearest straight line between a hot summer and a warming climate. Tiruchirappalli and Madurai, both in Tamil Nadu, follow the same pattern: every risky heat day counted in each city was one climate change made more likely.

Srinagar is the outlier worth pausing on. A city known for temperate summers recorded 53 risky heat days, more than any other Indian city in the dataset, of which 29 were attributed to climate change — a scale of departure from its own historical baseline far larger than what Mumbai or Delhi saw from theirs.

Where the heat did not arrive

Not every Indian city ran hotter than usual. Jaipur’s seasonal average came in 0.4°C below its 1991–2020 norm, Kota 0.2°C below, and Bhopal 0.1°C below — small numbers, but real ones, in a summer when most of the country and the world trended the other way. Even so, none of the three escaped the climate signal entirely: Jaipur still logged three risky heat days attributable to climate change, Kota three, Bhopal one. The exceptions are a reminder that a warming climate does not raise every thermometer in lockstep, even as it raises the odds almost everywhere.

What the numbers are measuring

The CSI framework Climate Central uses does not ask whether a heatwave happened — it asks how much more likely climate change made it. A CSI level of 2 or higher, the threshold used throughout this analysis, means the day’s warmth was at least twice as likely because of the human-driven build-up of greenhouse gases. That is a probability statement about cause, not a one-off weather reading, which is what allows the same framework to compare Mumbai’s long hot stretch against Chennai’s sharper, more clearly climate-driven spike.

Kristina Dahl, Climate Central’s vice president for science, described the pattern as one where “human-driven warming is pushing communities beyond safe physical limits” — a line written with Europe and North America in mind as much as South Asia. The India numbers suggest the same pressure is arriving unevenly within a single country: some cities absorbing a long, low-grade climate signal across most of the summer, others taking a shorter but far sharper hit concentrated into their worst weeks.

EP Staff is the editorial team at EdPublica, an independent media organisation focused on science, education, environment and public policy. The team produces evidence-based news, features, explainers and analysis on issues that shape society and everyday life.

Climate

Delhi’s Air Quality Paradox: Lower Average, Higher Everyday Pollution

Delhi’s average AQI fell by 15.8 per cent in 2026, but its median AQI rose by 14.1 per cent. A new assessment examines what these contrasting numbers reveal about the city’s everyday pollution.
Published

on

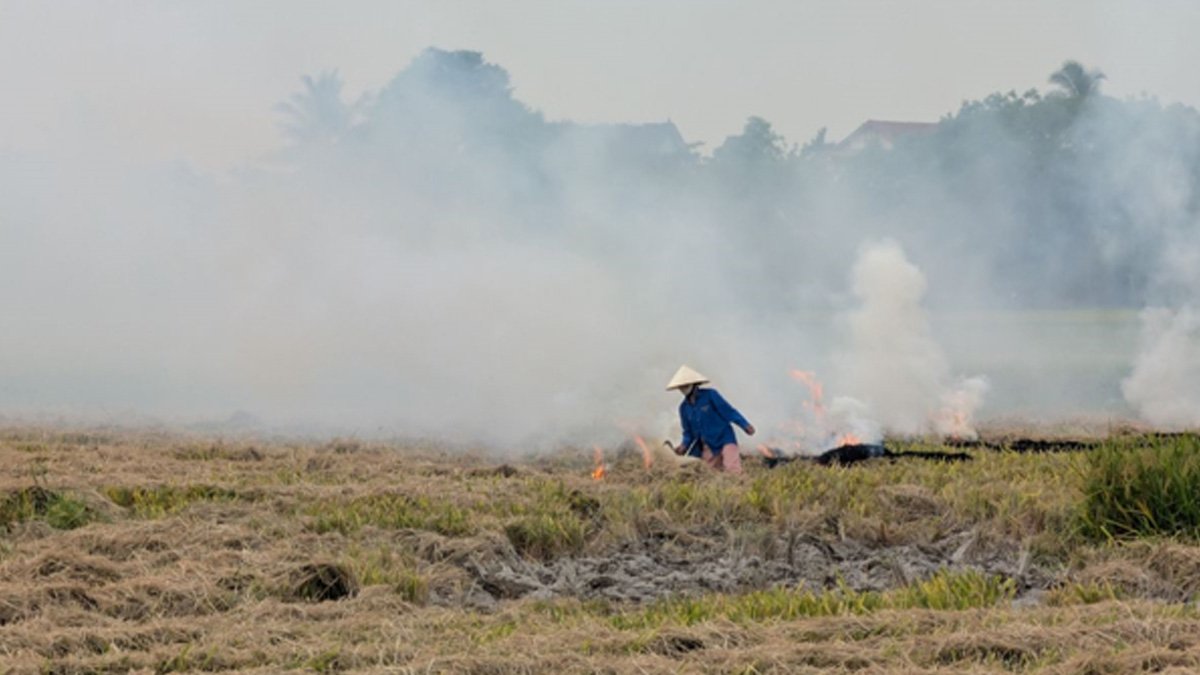
A farmer burns crop residue in a harvested agricultural field as thick smoke rises into the air.

Delhi recorded only three days with an Air Quality Index (AQI) above 200 between September 15 and October 23 this year. During the same period in 2025, the number was 10. Its average AQI also fell from 169.3 to 142.6, a 15.8 per cent improvement.

But there is another number in the data. Delhi’s median AQI rose from 135 to 154 during the same period. This means that although the city experienced fewer days of severe pollution, the air quality on a typical day was worse than the previous year.

The difference matters when assessing the health effects of air pollution. People are exposed to the air they breathe every day, not just during episodes when pollution reaches severe levels. Prolonged exposure is associated with respiratory and cardiovascular diseases, while polluted air can also affect children’s lung development.

A new assessment by Climate Trends, covering Delhi’s air quality, crop-residue burning in Punjab and Haryana, and meteorological conditions between 2024 and 2026, examines this gap between seasonal averages and everyday exposure.

What the AQI Average Leaves Out

The mean AQI is calculated using daily readings across a given period. A few exceptionally polluted days can push this average upwards. The median, on the other hand, is the middle reading when all daily values are arranged in order. It offers a better indication of what a typical day looks like.

Climate Trends’ analysis found that Delhi’s mean AQI declined by 15.8 per cent between 2025 and 2026. However, the median increased by 14.1 per cent. The maximum AQI also came down from 353 to 245, while the number of days above 200 dropped from 10 to three.

The improvement in the mean, therefore, was largely associated with the reduction in extreme pollution days. It did not indicate an improvement in the typical daily reading.

Aarti Khosla, Director of Climate Trends, draws attention to this difference.

“The average AQI fell 15.8% this autumn, and that is the number that will get reported as improvement. But the typical day, the one most Delhiites actually live through, got worse, up 14.1%.”

She argues that air quality policies should be evaluated using the pollution levels people experience regularly, rather than seasonal averages alone.

Farm Fires and Delhi’s Pollution: Numbers Don’t Move Together

Every October, crop-residue burning in Punjab and Haryana becomes a major focus of Delhi’s air pollution debate. Smoke from these fires can travel towards the capital, contributing to particulate pollution. However, the extent of its impact depends on weather conditions and the movement of air.

The three-year assessment found that the relationship between farm fires and Delhi’s AQI varied considerably across the study period. Between September 15 and October 15, 2025, satellite observations recorded 201 crop-residue fire events in Punjab and Haryana. In 2026, the number was 193, a decline of just four per cent. Delhi’s mean AQI, meanwhile, fell by 15.8 per cent.

The statistical correlation between daily fire counts and Delhi’s AQI also weakened. The same-day correlation coefficient fell from 0.62 in 2025 to 0.17 in 2026. The previous year’s figures show a different pattern. Between 2024 and 2025, combined fire events declined by 88 per cent, but Delhi’s mean AQI fell by only 3.9 per cent.

These comparisons do not establish that agricultural burning has no effect on Delhi’s air. They show that the number of fires alone cannot explain the city’s year-to-year AQI changes.

Dr Palak Balyan, Research Lead at Climate Trends, explains that the movement of smoke depends on atmospheric conditions.

“Wind direction, wind speed, rainfall and atmospheric mixing determine whether smoke is transported towards Delhi, dispersed or removed from the atmosphere.”

The study also identifies traffic, industrial emissions, road and construction dust, and other regional combustion sources as contributors to Delhi’s pollution. However, it does not quantify how much each source contributed to the AQI changes recorded in 2026.

El Niño: Game Changer

The assessment also considers whether the strengthening El Niño conditions in 2026 could explain the changes in pollution and agricultural burning. El Niño refers to the periodic warming of sea-surface temperatures in the central and eastern equatorial Pacific Ocean. It influences large-scale atmospheric circulation and can affect rainfall and temperature patterns in different regions.

According to the NOAA Climate Prediction Center assessment cited in the report, the Niño-3.4 sea-surface temperature anomaly reached approximately +2.1°C by October 2026. NOAA also projected an 83 per cent or higher probability of strong-to-very-strong El Niño conditions continuing through January–March 2027.

Despite these conditions, the combined number of farm-fire events in Punjab and Haryana did not increase. Delhi’s mean AQI also declined.

The local meteorological data present a more complicated picture. Delhi’s accumulated rainfall between September 15 and October 23 fell from 46.70 mm in 2025 to 10.19 mm in 2026, a decline of 78.2 per cent. Its mean planetary boundary layer height (PBLH), which indicates the depth of the lower atmospheric layer where pollutants are mixed, decreased by 4.3 per cent.

Lower rainfall reduces the removal of airborne particles through precipitation. A lower boundary layer can also limit the vertical space available for pollutants to disperse.

Mean wind speed increased by 2.1 per cent, from 2.40 to 2.45 metres per second. Stronger winds can help disperse pollutants, but their effect depends on direction and the areas from which the air is moving.

Dr Sagnik Dey, Head and Vipula and Mahesh Chaturvedi Chair Professor in Policy Studies at the Centre for Atmospheric Sciences, IIT Delhi, cautions against using El Niño as a direct indicator of air pollution.

“El Niño should not be viewed as a direct predictor of air pollution. Its influence on regional air quality depends on how large-scale climate variability interacts with local rainfall, temperature, wind patterns and atmospheric stability.”

The assessment does not establish that El Niño caused the observed changes in Delhi’s AQI. It also cannot isolate the contribution of individual weather conditions or pollution sources to the decline in the city’s average reading.

Health Cost of an Ordinary Day

The distinction between average and median AQI has implications beyond how Delhi’s annual pollution figures are reported.

Dr Harshal Ramesh Salve, Professor at the All India Institute of Medical Sciences (AIIMS), Delhi, points out that the health burden of pollution develops through prolonged exposure, rather than only during a handful of severe pollution episodes.

He identifies impaired lung development in children and increased lifetime cardiovascular risks among adults as concerns associated with sustained exposure. He also recommends early screening for high-risk adults and treating clean air as a year-round public health priority.

The 2026 assessment does not show that Delhi has solved its pollution problem. Its findings show that a decline in the number of severe days can improve the seasonal average without improving the air quality people experience on most days.

The study points to a need to examine Delhi’s pollution beyond the seasonal AQI average. With the median AQI rising despite fewer severe pollution days, the improvement recorded in 2026 does not reflect cleaner everyday air. The contribution of traffic, industrial activity, construction dust and other local sources needs closer assessment, particularly since the study could not isolate their individual impact. Without that understanding, the reasons behind Delhi’s changing air quality will remain only partially explained.

Continue Reading

Earth

252 Million Hectares Under Restoration Across 149 Countries, but UN Warns of 2030 Target Gap

A UN report finds that 252 million hectares across 149 countries are under ecosystem restoration. However, increased investment and accelerated action are needed to meet global restoration targets by 2030.

Published

on

River flowing through a forested mountain landscape with evergreen trees and snow-covered peaks.
Healthy mountain forests and river ecosystems play an important role in maintaining biodiversity and ecological balance.Image credit:Pexels

Global efforts to restore degraded ecosystems have reached 252 million hectares across 149 countries, generating more than one million green jobs. However, a new United Nations assessment warns that restoration efforts remain insufficient to meet international biodiversity targets by 2030, calling for a more than fourfold increase in annual investment.

The findings are presented in the Restoration Progress Report: Nature’s Comeback – Scaling Ecosystem Restoration for People and Planet, released on October 29, 2026, by the United Nations Environment Programme (UNEP), the Food and Agriculture Organization (FAO) and the Secretariat of the Convention on Biological Diversity (CBD).

The report provides the first comprehensive global assessment of progress towards commitments to restore approximately one billion hectares of degraded ecosystems. These commitments are linked to the UN Decade on Ecosystem Restoration (2021–2030) and the Kunming-Montreal Global Biodiversity Framework, which calls for at least 30 per cent of degraded terrestrial, freshwater, marine and coastal ecosystems to be under effective restoration by 2030.

According to the assessment, the 252 million hectares currently documented under restoration represent the largest recorded global restoration effort. However, this accounts for only 34 per cent of the indicative global benchmark associated with the 2030 target.

Freshwater and marine ecosystems lag behind

The report identifies considerable differences in restoration progress across regions and ecosystem types. Asia accounts for the largest share of documented restoration, with 192.2 million hectares, followed by Africa with 36.3 million hectares and Europe with 9.1 million hectares. North and Central America account for 5.8 million hectares, South America 5.4 million hectares and Oceania 3.2 million hectares.

However, the report cautions that these figures should not be interpreted as a ranking of restoration performance, as they also reflect differences in regional land area and monitoring and reporting capacities.

Restoration of terrestrial ecosystems has reached nearly half of the global 2030 target. China reports the largest terrestrial restoration area, with 127.4 million hectares, while substantial restoration activities have also been documented in Mongolia and Kazakhstan.

Progress remains considerably slower in freshwater, marine and coastal ecosystems, despite these environments experiencing rapid degradation.

restoration
ecosystem

A river along the side of a dense forest. Image credit: Pexels

The assessment documents 11 million hectares of freshwater ecosystems under restoration across 62 countries and 5.7 million hectares of marine and coastal ecosystems across 46 countries. The report also notes that limited monitoring and reporting may mean that actual restoration activities in these ecosystems are higher than the documented figures.

Meanwhile, the share of countries reporting implemented wetland restoration or rehabilitation programmes has increased from 8 per cent in 2022 to 54 per cent.

Restoration financing needs to increase fourfold

Insufficient investment remains a major obstacle to achieving global restoration commitments. The report estimates that annual restoration financing must increase from US$64 billion to US$296 billion by 2030, representing more than a fourfold rise.

Agroforestry requires the largest estimated annual investment, at US$87 billion, followed by restorative reforestation at US$52 billion, peatland restoration at US$44 billion and seagrass restoration at US$28 billion.

The report identifies employment generation as another potential benefit of scaling up restoration. While more than one million green jobs have already been associated with restoration initiatives, increased global investment could generate up to 32 million additional jobs by 2030.

It also highlights the potential contribution of ecosystem restoration to climate mitigation and biodiversity protection. Research cited in the assessment indicates that restoring just 15 per cent of global priority areas could capture and store 30 per cent of carbon dioxide-equivalent emissions released since the Industrial Revolution and help prevent 60 per cent of projected species extinctions.

The report further identifies the participation and leadership of Indigenous Peoples and local communities as essential to ensuring long-term restoration outcomes. Secure land rights, stronger monitoring systems and sustained political commitment are among the priorities identified.

With five years remaining in the UN Decade on Ecosystem Restoration, the assessment calls on governments to move beyond isolated restoration projects towards coordinated, long-term programmes that address the underlying causes of ecosystem degradation.

It emphasises that the 2030 targets should serve as a milestone in the restoration process rather than its conclusion, as ecological recovery requires sustained action and investment beyond the end of the decade.

Continue Reading

Climate

El Niño Could Help Forecast India’s Humid-Heat Risks Six Months Ahead, Study Finds

New research suggests that El Niño and other tropical climate signals could help forecast India’s humid-heat risks and potential labour productivity losses up to six months in advance, offering more time to protect outdoor workers.
Published

on

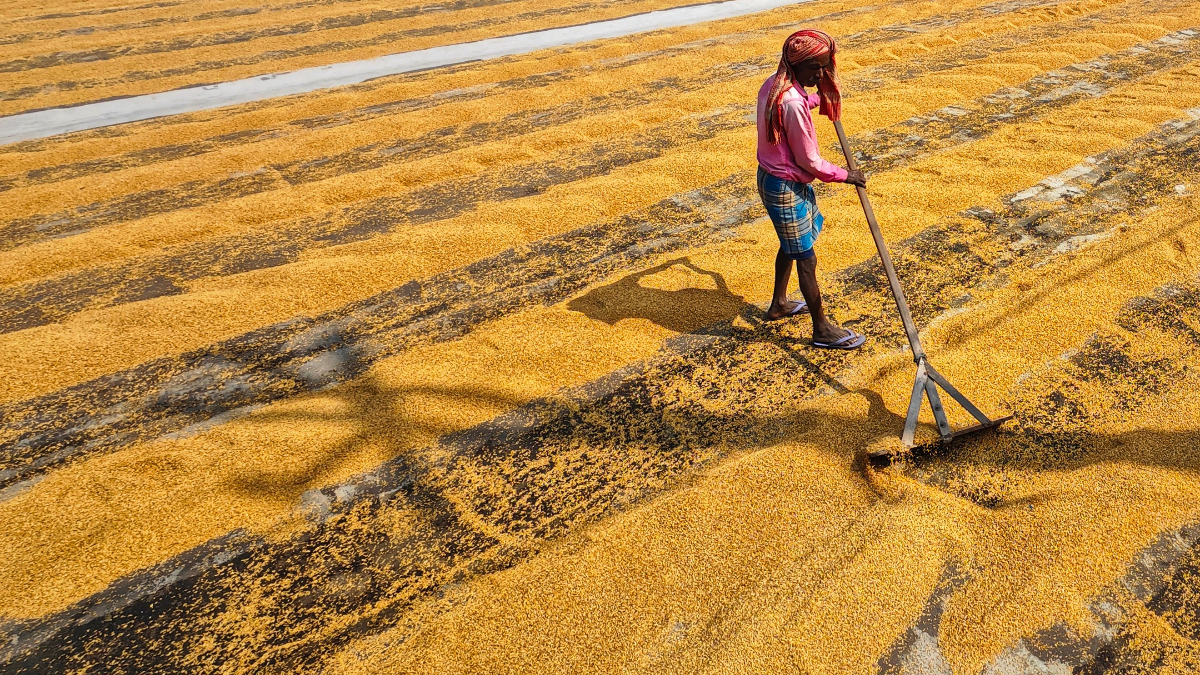
A woman worker spreads and levels harvested grain in an open field under direct sunlight.
An agricultural worker levels harvested grain in an open field, illustrating the outdoor labour exposed to heat and changing climate conditions.Image credit:Pexels

India could gain up to six months to prepare for the risks of extreme humid heat, as researchers have identified a link between El Niño and heat-related losses in working capacity. The findings could help authorities strengthen heat action plans, prepare health services and protect workers in agriculture, construction and other outdoor occupations.

The study, published in the Journal of Geophysical Research: Atmospheres in July 2026, found that the El Niño–Southern Oscillation (ENSO), a climate pattern involving changes in tropical Pacific Ocean temperatures and atmospheric circulation, is strongly associated with year-to-year variations in potential productivity losses caused by humid heat. The research, led by researchers at the Indian Institute of Tropical Meteorology (IITM), Pune, suggests that these losses could be predicted up to six months in advance.

According to a report published by Nature India on October 28, the researchers analysed historical climate and population data from 1950 to 2020, using heat-stress measures including Humidex and wet-bulb globe temperature (WBGT). Their analysis found that tropical Indo-Pacific ocean temperatures could explain approximately 42% of the variation in India’s potential productivity losses associated with humid heat.

The findings offer a possible early-warning tool for a country where millions of people work outdoors and exposure to high temperatures can threaten both their health and livelihoods.

Rising heat stress and its economic consequences

The study found that global potential productivity losses associated with Humidex values exceeding 45°C increased approximately 18-fold between 1950–1954 and 2016–2020. India’s estimated losses rose around 23-fold over the same period, accounting for more than half of the global increase.

Researchers attributed the rise in India to climate change and population growth, which contributed almost equally to the increase. Even if population had remained constant, climate change alone would have driven a four-to-fivefold increase in potential productivity losses, the study found.

The researchers also identified a faster rise in humid-heat risks from the mid-1980s, coinciding with average sea-surface temperatures in the Indo-Pacific warm pool crossing 28°C.

The findings are particularly relevant to India’s informal workforce, where outdoor workers often have limited opportunities to avoid heat exposure without losing income.

A separate study published in Scientific Reports in March 2026 examined heat stress among 1,560 outdoor workers across 11 districts of Tamil Nadu. Researchers found that WBGT measurements exceeded the critical threshold of 30°C. Workers exposed to elevated heat stress had 1.4 times the risk of reporting productivity losses compared with those without such exposure.

The study also found that 15% of surveyed workers reported losing daily wages because of heat during summer. The findings provide region-specific evidence of how rising temperatures can affect both working capacity and household incomes.

Turning forecasts into worker protection

The new research could help authorities move beyond responding to heatwaves after they develop. Longer-range risk estimates could give health departments time to review heatstroke treatment capacity, disaster-management agencies time to prepare resources, and labour departments time to plan protective measures for outdoor workers.
humid
el nino
heat

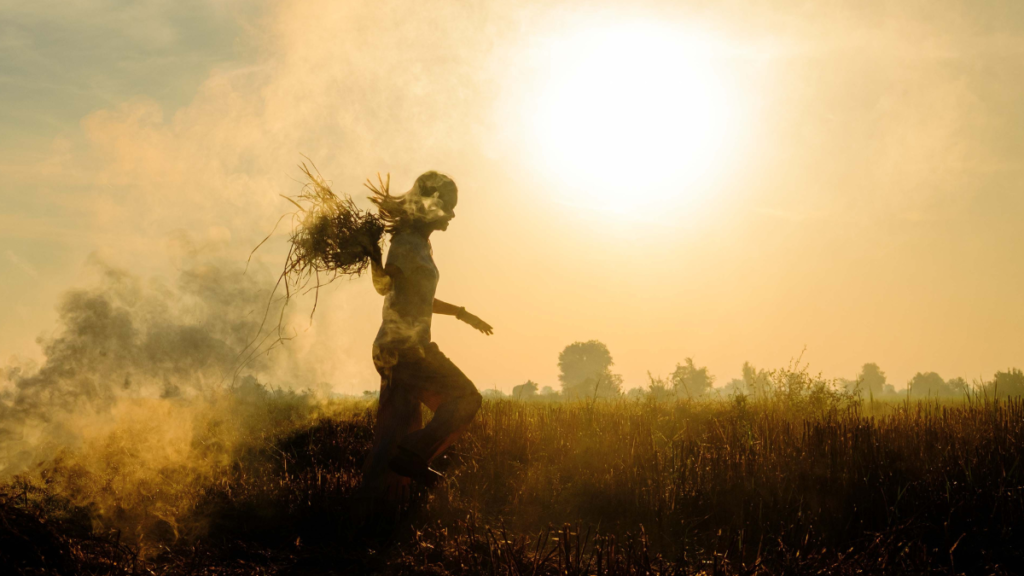
Silhoutte of a farmer working in a hot summer.Image credit:Pexels

India already issues seasonal temperature and heatwave outlooks, alongside shorter-range heat-index forecasts. Integrating longer-range climate signals with these systems could strengthen preparedness, provided the forecasts are tested and translated into practical protocols.

However, the researchers and climate experts caution that predictability does not eliminate uncertainty. India’s weather is influenced by several interacting oceanic and atmospheric systems, and El Niño does not produce identical rainfall or temperature outcomes every year.

The term “super El Niño” also has no formally defined category under the India Meteorological Department or the World Meteorological Organization. In a July 2026 parliamentary response, the Ministry of Earth Sciences said El Niño conditions could strengthen during October–December, potentially reaching the very strong category, while noting that regional impacts depend on several factors.

The central challenge, therefore, is to ensure that improved climate information leads to timely action. Forecasts must be combined with local weather observations, workplace conditions and workers’ experiences to identify those facing the greatest risks.

As humid heat intensifies, advance warning could become an important tool for reducing avoidable health and economic losses. But its effectiveness will depend on whether governments and employers can turn that warning into safer working conditions without forcing vulnerable workers to choose between their health and their income.

Continue Reading

Trending