
Energy
IEA’s New Report on What Would a Net-Zero Compatible Electricity System Require
Global electricity demand is rising rapidly, but building a net-zero-compatible power system will require far more than new generation. The IEA outlines the grids, storage and flexibility needed to keep pace.

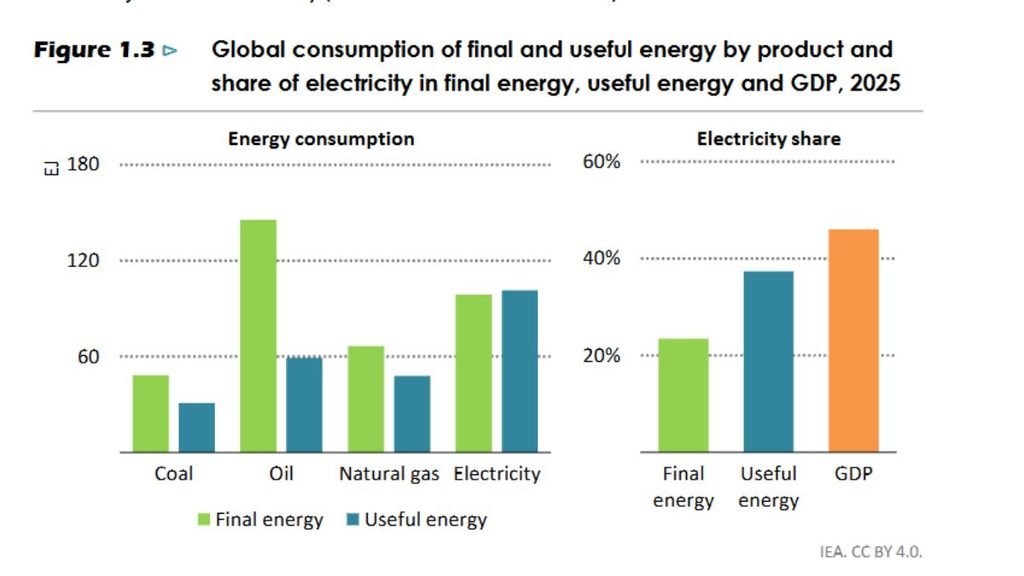
An electric car plugged in at night, a heat pump warming a home and a factory replacing a gas-fired process with an electric one may look like separate changes. They are becoming part of the same transformation or some say, the age of electrification. The change is already underway if we look closer. Global electricity demand exceeded 28,500 terawatt-hours in 2025 and has grown by more than 3% a year over the past decade, almost twice as fast as overall energy demand.
The International Energy Agency’s latest Special Report on Electrification points to the same scale of change. Its High Electrification Scenario, or HES, sees electricity rising from 23% of global final energy consumption today to 35% by 2035. The scenario is designed to be compatible with the IEA’s net-zero pathway when combined with measures such as energy efficiency.
That would mean another 1,400 TWh of electricity demand every year through 2035, about twice the annual increase recorded during the previous decade. But are we ready to keep up with this mass consumption?
Jan Rosenow, Professor of Energy and Climate Policy at Oxford University, said the technologies needed for faster electrification are already available, but current progress remains insufficient.
“Electrification is the most important lever we have to build a clean, secure and affordable energy system. today’s report shows the technologies are ready and the economic case is strong, but current progress falls well short of what is needed. We are still in the middle of an energy crisis with crippling oil and gas prices and governments must now act across every sector, from buildings and transport to industry.”
A Rapid Power Build-Out
Much of the new demand is likely to come from activities that currently depend on fossil fuels. The IEA estimates that, using current costs, prices and financing conditions, the share of electricity in final energy use could rise from 23% to around 33% globally through cost-effective opportunities alone. The HES pushes that further, to 35% by 2035.
But that extra electricity cannot simply come from whatever power plants happen to be available. Electricity generated from low-emissions sources accounted for 42% of global generation in 2025, up from 33% in 2015. Solar deployment increased more than tenfold during the decade and wind deployment more than doubled.
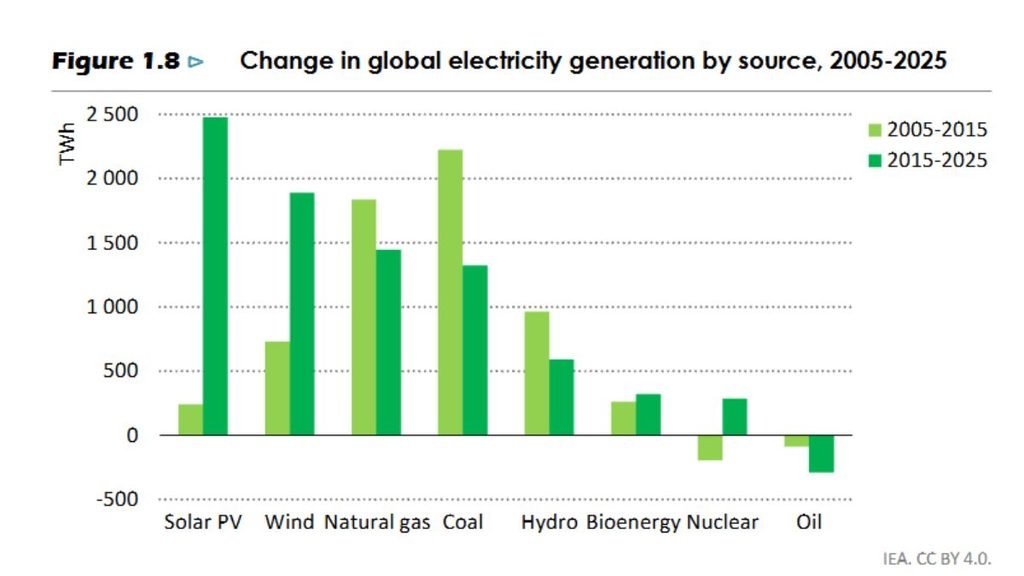
At the same time, fossil-fuel generation also increased. Power generation still produces around 14 billion tonnes of CO₂ a year, and global power-sector emissions have not yet peaked. For a net-zero-compatible system, the problem is therefore twofold: generate much more electricity while changing what generates it.
Janet Milongo, Senior Manager Energy Transition at CAN International, said the proposed 35-by-35 target would need to be assessed not only by how much energy becomes electric, but by how that electricity is generated and governed.
“The 35 by 35 target will only represent climate progress if it is powered by sustainable renewable energy. Success cannot be measured simply by how much of the world’s final energy consumption becomes electric. We must ask what generates that electricity, who has access to it, who owns the infrastructure, and whether it is helping countries transition away from fossil fuels. Developing countries must have the resources and capacity to own, govern and shape their electricity systems in the public interest.”
Solar Panels are Only the Beginning
By 2035, annual solar additions would need to exceed 1,200 GW, while annual wind additions would reach around 400 GW. Nuclear power would also expand substantially. This would provide electricity for the new demand created by electrification while replacing part of the fossil-fuel generation already on the system.
If an electric vehicle is charged with electricity produced by a fossil-fuel power plant, the energy system has changed, but its emissions have not disappeared. Electrification can deliver its full climate benefit only as the electricity supplying it becomes cleaner.
The same applies to factories, buildings and other major users. The result is a system that needs to expand generation at the same time as it changes its composition. That makes the transition more demanding than simply replacing one technology with another.
The Problem of Transfering Power
None of the sources of electricity can serve a household or factory without a network connecting generation to demand. The IEA estimates that the global electricity network would need to reach around 115 million kilometres by 2035 under the HES, with network expansion accelerating by about 40% compared with the previous decade.
That is a major infrastructure requirement, particularly because the geography of electricity supply and demand is changing. Solar generation is concentrated in certain hours. Wind output varies with weather. New renewable projects may be located far from industrial centres or cities. Meanwhile, electric vehicles, cooling and heating can create new peaks in demand.
A system built for relatively predictable electricity flows therefore has to become much more flexible. The IEA identifies connection queues, grid congestion and renewable curtailment among the problems that could slow the transition. Building transmission and distribution infrastructure earlier, improving the use of existing networks and speeding up planning and permitting become part of the climate strategy.
The grid is no longer simply the infrastructure that delivers electricity after it has been generated. It becomes one of the conditions for adding more clean generation in the first place.
Demand Side Matters
Storage is one response to this changing system. Under the IEA’s net-zero pathway, battery storage capacity would rise to around 2,900 GW by 2035, almost ten times current levels.
But the report’s picture of flexibility is broader than batteries. An electric vehicle does not necessarily have to charge at the moment it is plugged in. Some industrial processes can be shifted. Heating and cooling systems can respond to changing electricity availability. Water heaters can operate at times when the grid has more capacity.
That means electricity demand itself can become more flexible. This could become particularly important in countries where solar generation peaks during the day while electricity demand rises later in the evening.
India is one example. The country has been adding solar capacity while its electricity demand increasingly extends into evening and night-time hours. A larger solar fleet can increase daytime supply without automatically solving an evening peak.
How much electricity generated can move, store or shift to when people need it?
Richer Countries: Different Problem
In wealthier economies, electricity access is largely established. The challenge is what happens when an existing system suddenly has to serve much more demand and more variable sources of supply.
Electric vehicles, cooling, heat pumps, data centres and industrial electrification can all add load. At the same time, many of these countries have grids and power infrastructure designed around older patterns of electricity consumption. Some networks will need to be strengthened or replaced; others will need better digital controls to manage increasingly complex electricity flows.
There is also a financial problem at the household level. An electric technology can cost more to purchase while costing less to operate. That creates a barrier for households and businesses that cannot afford the initial investment, even when the technology may make economic sense over its lifetime. The IEA therefore sees financing and targeted support as part of the electrification challenge rather than as an issue separate from the energy transition.
India Sits Across Both Worlds
India illustrates how different parts of the challenge can exist within the same electricity system. Electricity demand grew by around 5% a year between 2015 and 2025. The country is also rapidly expanding renewable generation and electrifying transport.
There is significant room to electrify industrial processes. Nearly 30% of India’s industrial heat demand is below 150°C, a range where the IEA identifies substantial potential for electrification. Electric two- and three-wheelers provide another important opportunity.
But the changing timing of electricity demand creates a separate challenge. As solar generation grows during daylight hours, demand continues into the evening and night. That makes storage, flexible demand, electricity pricing and better use of the grid increasingly important. India therefore faces both sides of the global transition: expanding access to reliable electricity and preparing an already large electricity system for a much more electricity-intensive economy.
Test Between Generation and Consumption
The IEA’s proposed “35-by-35” target is ultimately a measure of how deeply electricity could enter the global energy system by 2035. But reaching that level would require much more than a larger supply of electricity.
It would require clean generation to grow fast enough to meet new demand and replace fossil generation. It would require transmission and distribution networks to expand before they become bottlenecks. It would require batteries and other forms of storage, alongside demand flexibility, to manage when electricity is produced and consumed.
Dave Jones, co-founder of Ember, described faster electrification as having benefits across household costs, emissions and energy security.
“Today’s report gives us the evidence we have all been waiting for to show that faster electrification is a triple win. A win for cheaper bills, a win for less emissions and pollution, and a win for cutting the huge fossil fuel import bill many countries face today.”
And it would require very different approaches in different parts of the world. In advanced economies, the priority is largely to transform and expand existing systems. In countries with major access gaps, electricity infrastructure has to grow alongside basic services and economic activity. Countries such as India are dealing with both challenges at once.
The technologies for much of this transition already exist. The harder task is putting them together at the required scale — and making sure the money, infrastructure, skills and institutions move with them.
That is the central question behind a net-zero-compatible electricity system: not simply whether the world can produce more electricity, but whether it can build an electricity system capable of carrying an increasingly electrified economy without carrying fossil-fuel emissions along with it.











Energy
India’s Clean Energy Research Funding Falls Short of Manufacturing Ambitions, Study Finds
A study of 1,359 publicly funded projects finds that India’s clean energy research priorities may not be sufficiently aligned with its manufacturing ambitions, highlighting the need for a clearer strategy linking innovation, industrial capacity and the Viksit Bharat @2047 vision.
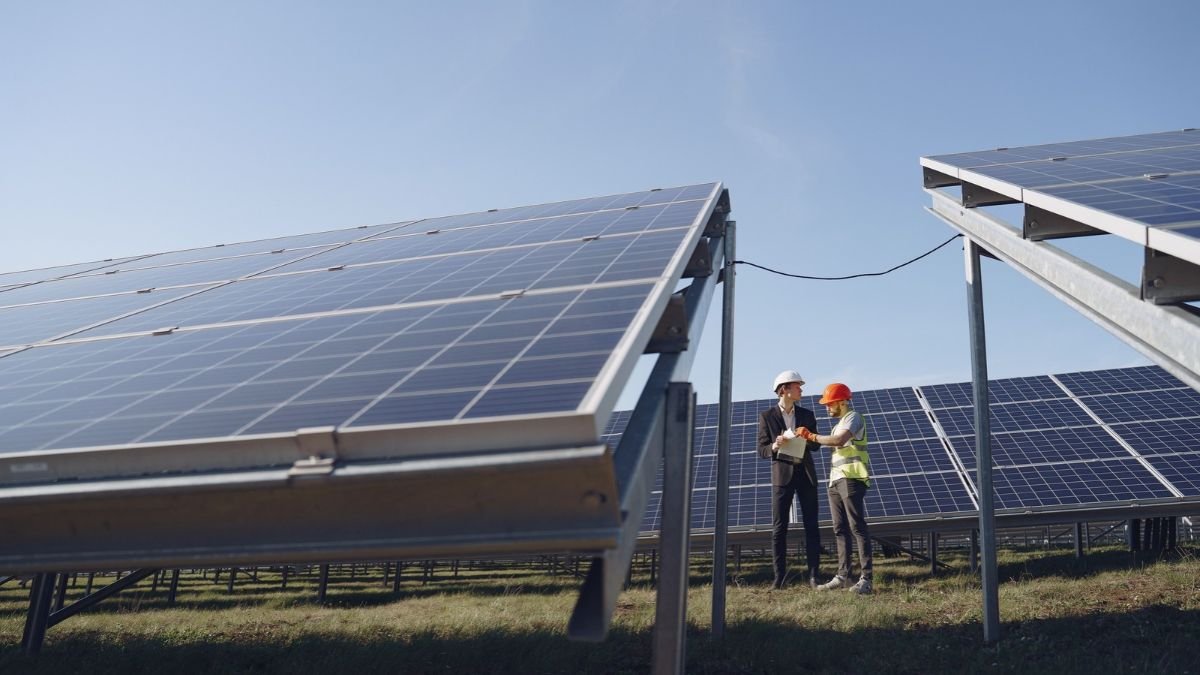
As India works towards its Viksit Bharat @2047 vision, the ambition to become a developed economy will depend in part on whether the country can turn its clean energy research into the technologies, manufacturing expertise and industrial capacity needed to power its transition. But along with sits the the Department of Science and Technology’s Research & Development Statistics 2025–26 where India’s gross R&D expenditure at ₹2.45 lakh crore in 2023–24, equivalent to 0.84% of GDP. Private-sector spending contributed 51.8% of the total that year, overtaking the government sector’s 48.2% share.
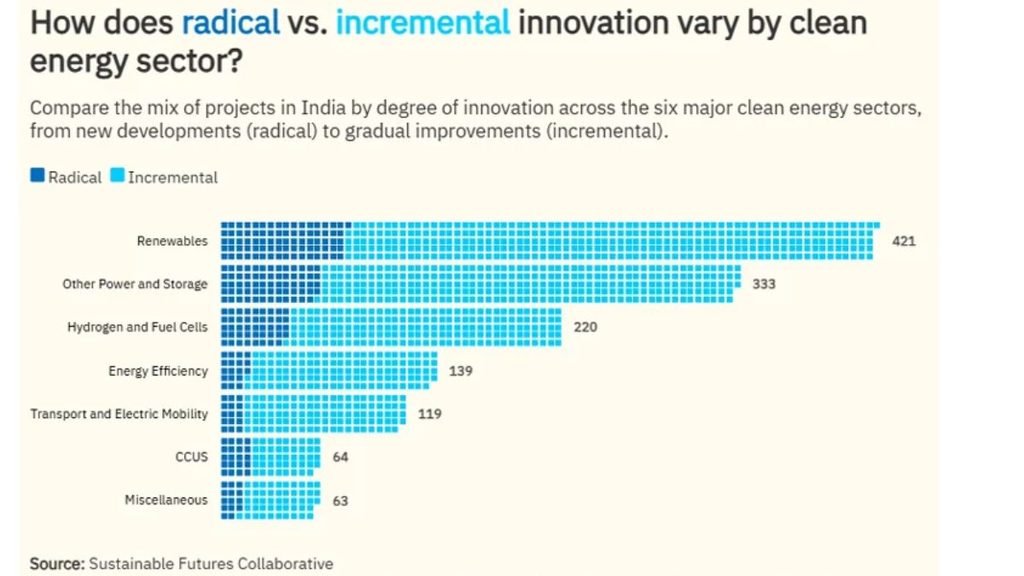
A study by the Sustainable Futures Collaborative (SFC) and the Climate Policy Lab at Tufts University has mapped 1,359 publicly funded clean energy research, development and demonstration projects across more than 90 institutions between 2019 and 2024. The projects account for approximately ₹1,443 crore in declared funding.
The study found that 81% of the projects focused on improving or adapting technologies already in commercial use, while 67% concentrated on products rather than manufacturing processes. Research into manufacturing processes accounted for about a third of projects but received only a fifth of the declared spending. India’s clean energy industrial policy now focuses on the question on how much public research funding is helping the country develop the capabilities needed to manufacture its own technologies, rather than primarily improving products that already exist?
Solar Manufacturing Exposes the Research Challenge
India’s solar industry illustrates why that question matters. Manufacturing capacity has grown rapidly, but capacity to produce solar modules and the cells inside them has developed at different rates. An analysis by the Council on Energy, Environment and Water (CEEW) estimated India’s solar module manufacturing capacity at 173 gigawatts, compared with approximately 30 gigawatts of solar cell manufacturing capacity. The difference means that the industry remains dependent on imported cells for a substantial share of its module production.
According to CEEW, around 80% of India’s module manufacturing capacity would depend on imported solar cells, primarily from China, based on the capacities assessed in its study. Solar cells are also a major component of module costs, accounting for nearly 60% of the cost of a solar module, according to the analysis.
This gap illustrates the difference between expanding assembly capacity and developing a more integrated manufacturing supply chain. Domestic cell production requires technological expertise, specialised equipment and the ability to manufacture increasingly efficient cells at competitive costs.
The SFC–Tufts study found that solar photovoltaic research received ₹401 crore, making it the largest individual technology category in the publicly funded research portfolio. That was more than the combined funding allocated to hydrogen, energy efficiency, transport and carbon capture, utilisation and storage.
The concentration of funding in solar does not, by itself, establish that the allocation is misplaced. The research portfolio also covers different stages of technological development. The concern raised by the study is whether the overall balance of funding adequately supports manufacturing capability alongside deployment and product development.
Battery Manufacturing Shows the Cost of Capability Gaps
India’s battery industry faces a related challenge. The government approved a production-linked incentive scheme in 2021 with an outlay of ₹18,100 crore to establish 50 gigawatt-hours of domestic advanced chemistry cell manufacturing capacity.
A February 2026 response by the Ministry of Heavy Industries to Parliament reported that 40 GWh of capacity had been awarded to four beneficiary companies. However, only 1 GWh of manufacturing capacity had been installed under the scheme as of the end of December 2025. The ministry said domestic demand for advanced chemistry cells continued to be met largely through imports.
The ministry identified several implementation challenges, including limited technology availability, shortages of skilled workers, dependence on imported machinery and the lack of upstream components such as cathode and anode active materials and electrolytes.
These constraints help explain why manufacturing ambitions require a supporting research and technology ecosystem. Building a battery factory involves more than securing investment and installing production lines. Manufacturers also need access to cell technologies, materials, specialised equipment and technical expertise.
Small Grants Dominate Public Research Funding
Another problem is that the funding structure is dominated by relatively small grants. Around 68% of the projects received less than ₹50 lakh each, while the median grant size varied little across technology areas, ranging from ₹33 lakh to ₹39 lakh.
The Department of Science and Technology funded just over half of the projects, largely through numerous small grants. The Ministry of New and Renewable Energy supported a smaller number of substantially larger programmes. The 20 institutions with the highest project counts accounted for 68% of all projects.
Small grants can support early-stage research, enable researchers to test ideas and allow institutions to explore different technological approaches. The study does not assess whether individual grants produced useful results or whether their size was appropriate for their objectives.
Its concern is about the combined portfolio. The available public record does not reveal an explicit strategy connecting the distribution of research funding with India’s broader priorities for clean energy deployment, manufacturing and technological leadership.
The researchers therefore raise a question about the purpose of the funding system: should public investment maintain a broad range of exploratory research, or should a greater share be directed towards selected technological capabilities that are important to India’s industrial ambitions?
The answer would influence how research programmes are designed, how funding is distributed and how progress is assessed. Manufacturing-oriented research, for instance, may require different funding scales and longer development periods than projects focused on incremental improvements to existing products.
Clean Energy Research: Wider Strategy for Innovation
India has introduced manufacturing incentives to expand domestic production of solar modules and advanced chemistry cells. These programmes demonstrate that industrial capacity is already a policy priority. The research study examines a different part of the same challenge: whether public research investment is organised to help develop the technologies and production capabilities those industries need.
The distinction matters because manufacturing capacity figures alone do not establish how much technological value is being created domestically. A country can expand final-product manufacturing while remaining dependent on imported cells, components, machinery or materials.
The report calls for greater alignment between clean energy research and India’s manufacturing and deployment ambitions. Such alignment would require a clearer view of which capabilities India already possesses, where critical gaps remain and how public research funding can help address them.
The study also has important limits. It relies on publicly available disclosures, with budget information missing for around 16% of projects and start years missing for 39%. Private-sector research—which the report says accounts for roughly half of India’s national research and development spending—is not captured. Demonstration projects and industry-linked research may also be underrepresented.
The database is therefore a substantial mapping of publicly visible research activity, rather than a complete account of India’s clean energy innovation system or an assessment of the outcomes of individual projects. Its central finding is about coordination. India has set ambitious goals for clean energy deployment and domestic manufacturing, but the public record does not yet show clearly how the country’s research investments add up to a strategy for achieving both.
Energy
India Captures 5.7% of Global Greenfield Investment, Outpacing China
India accounted for 5.7% of global greenfield investment between 2020 and 2025, more than double China’s share. UNCTAD data highlight the concentration of investment in AI infrastructure, semiconductors and energy-transition technologies.
Earth
Hunter Valley Coal Mine Gets Approval to Run to 2045. What Does It Mean for Australia’s Climate Transition?
Australia’s Hunter Valley coal mine has been approved to operate until 2045, raising questions about how the extension fits into the country’s transition towards lower emissions and its net-zero target.
Australia’s transition away from fossil fuels faces a new test after New South Wales approved the continuation of the Hunter Valley Operations (HVO) coal mine until 2045.
The NSW Independent Planning Commission (IPC) on September 30 approved the continuation of HVO North until the end of 2045 and HVO South until the end of 2042. The project would allow an estimated 429 million tonnes of coal to be extracted from the Hunter Valley near Singleton.
The decision is significant not only because of the scale of the mine, but because it extends a major coal operation into the period in which Australia is committed to sharply reducing its greenhouse-gas emissions.
Australia’s current climate commitments include cutting national emissions by 43 per cent from 2005 levels by 2030 and by 62–70 per cent by 2035, with net-zero emissions targeted for 2050.
The latest government inventory estimates Australia’s emissions at 452.4 million tonnes of carbon dioxide equivalent in the year to June 2026, a preliminary 1.8 per cent decline from the previous year. Emissions in the year to March 2026 were 25 per cent below 2005 levels.
Against that backdrop, the IPC acknowledged that the HVO project would have a substantial climate footprint. Its statement of reasons estimates that the project could result in about 809 million tonnes of greenhouse-gas emissions from local mining operations and the eventual combustion of exported coal overseas. The commission said those emissions would contribute to climate impacts in the Hunter, NSW and globally.
The 809-million-tonne figure needs an important qualification to note. it is a lifecycle-related estimate that includes overseas combustion emissions and should not be interpreted as emissions produced directly by the mine.

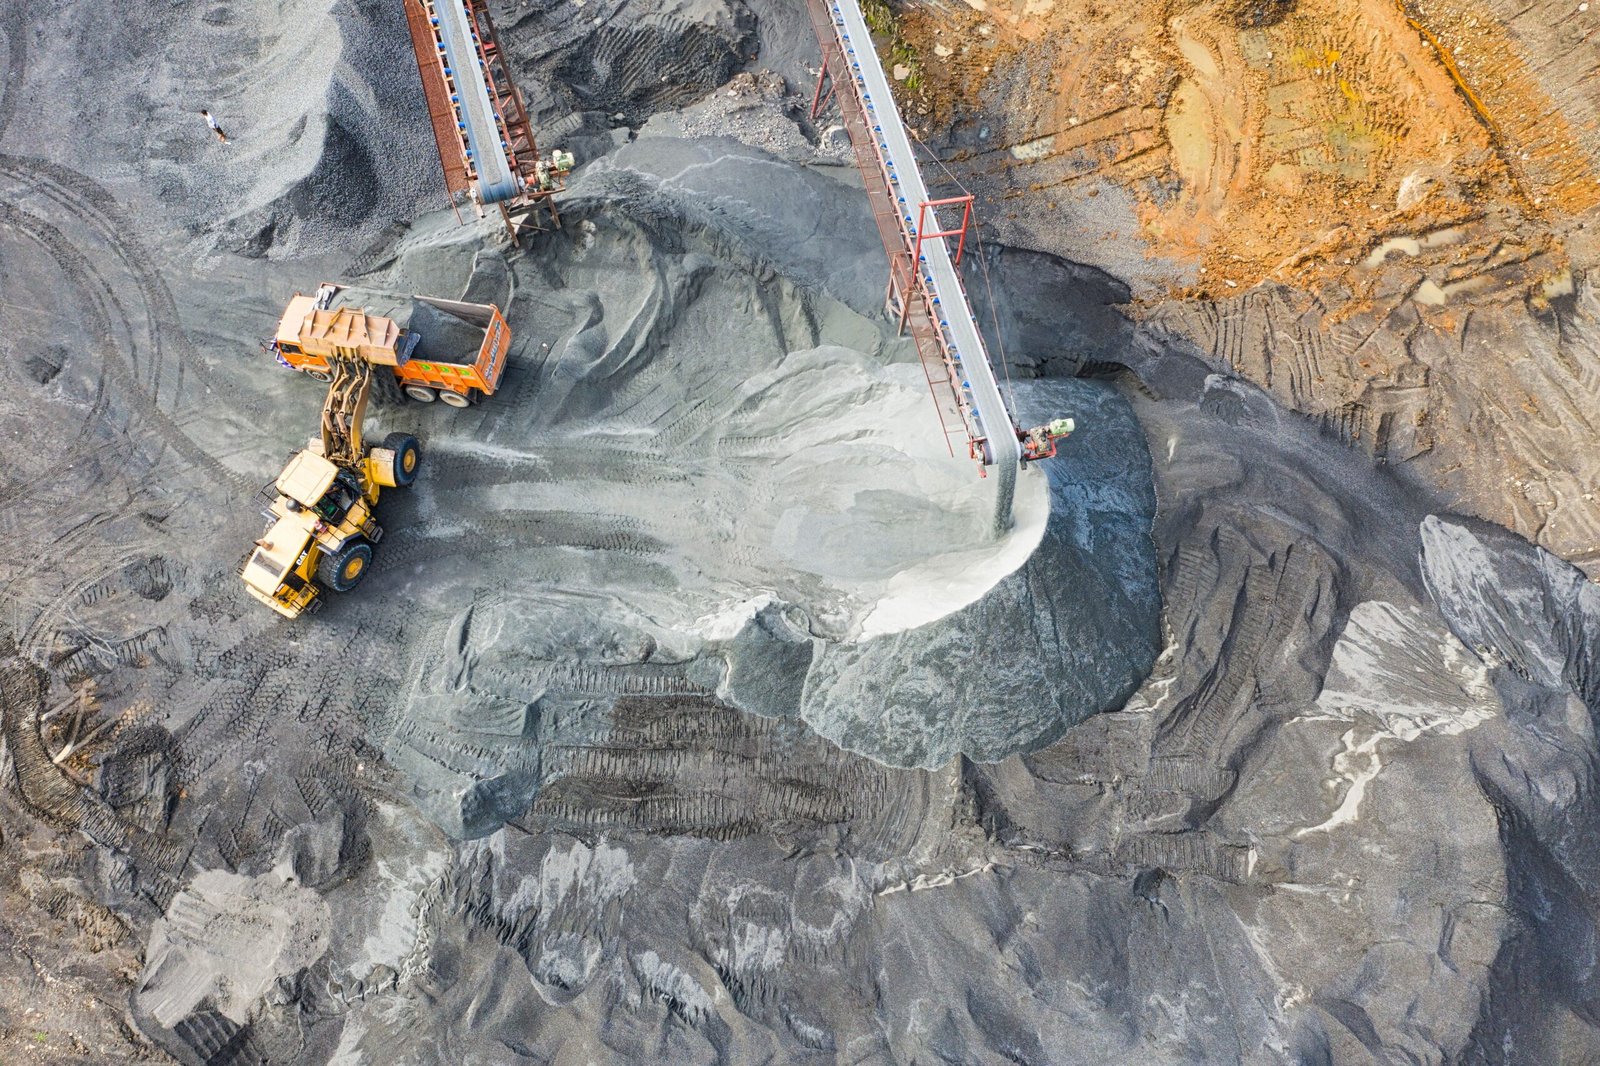
Coal mine.Representational image.Image credit:Pexels
The economic case for the extension is substantial. HVO employs more than 1,500 people and engages more than 800 suppliers, according to evidence presented to the IPC. The NSW Government says the continuation could secure up to 1,500 ongoing jobs and create about 600 temporary positions through infrastructure upgrades, subject to federal approval.
The approval also comes with conditions intended to address the mine’s emissions and its eventual transition. HVO must prepare a Scope 3 Management Plan dealing with emissions associated with exported coal, maximise renewable electricity use at the mine and purchase additional carbon offsets. It must also prepare a comprehensive closure plan within 12 months, in consultation with local councils and communities, outlining how the mine will transition towards closure while supporting workers and the local economy.
The NSW Government argues that the decision can support regional employment while maintaining the state’s broader emissions-reduction pathway. It says the approved proposal has 43 per cent lower Scope 1 emissions than the company’s 2022 application. NSW’s 2026–50 coal policy also allows extensions of existing mines while ruling out applications for new greenfield coal mines.
At the national level, the federal Safeguard Mechanism is intended to reduce emissions from Australia’s largest industrial facilities. The government says the mechanism is designed to put covered facilities on a trajectory consistent with the country’s 2030 target and net-zero goal.
That creates the central question around HVO’s extension. How does Australia manages the economic and employment role of existing coal regions while reducing emissions over the same period.
The NSW approval does not settle that question. The project still requires approval from the Australian Government under the Environment Protection and Biodiversity Conservation Act.
For the Hunter Valley, the decision provides a longer operating horizon for an established coal industry. For Australia’s climate transition, it brings the challenge of managing an economy in which existing fossil-fuel assets continue operating while national policy seeks progressively sustainable energy and lower emissions.

India Unveils Three Homegrown AI Models, Covering 22 Indian Languages

Indian universities lead Asia in research output per faculty, but the country’s top six all slip in QS ranking

Greener Forests, Weaker Carbon Sinks? Study Finds Declining Productivity in Northeast India

Climate Change Contributed to 10,600 Excess Preterm Births in Asia During April 2024 Heatwave

Neuropixels Probes Allow Scientists to Record Hundreds of Brain Cells at Once, Opening New Possibilities for Neuroscience
Indian universities lead Asia in research output per faculty, but the country’s top six all slip in QS ranking

Knowing When to Think for Ourselves: AI, Intuition and the Education of Discernment

After a Scorching Summer, Delhi’s Children Are Slow to Return Outdoors

Two Chemists Win Nobel Prize for Solving a Century-Old Puzzle: Why Life Picks One Hand Over the Other

Climate Change, Overfishing and the Uncertain Future of Bangladesh’s Hilsa Fishermen
-

 Math3 months ago
The 2026 Fields Medals: Four Proofs, Four Decades-Old Problems Solved
-
EP Deep Dive: Data & Solutions3 months ago
After Kerala’s Deadliest Landslide, the Hardest Thing to Rebuild Was Childhood
-
EP Deep Dive: Data & Solutions4 months ago
West Asia Crisis: Can Kerala’s Returning Gulf Migrants Find a Future in the Green Economy?
-
Space & Physics5 months ago
India Semiconductor Mission: ‘It’s Not About Fabs. It’s About Building An Entire Ecosystem’
-
Interviews1 month ago
From Scams to Screens: How the National Stock Exchange Rewrote India’s Equity Story
-
Climate & Environment5 months ago
The Climate World Cup? How Climate Change Could Affect Player Performance at the 2026 World Cup
-
Society4 months ago
What Is Civilisational Diplomacy? Understanding India’s Newest Foreign Policy Tool
-
Society5 months ago
From Bell Labs to the Classroom: A Second Career in Teaching