
Sustainable Energy
When the Sun Goes Down, Is India’s Solar Boom Ready to Face Its Real Test
India’s solar expansion is entering a new phase, where generating electricity is only part of the challenge. A new IECC study examines how battery storage can make solar power available after sunset and during periods of weaker generation, while showing how India’s monsoon and regional climate patterns shape the cost and scale of storage needed.

India’s story of solar energy has largely been a story of scale. More panels, more capacity, more electricity from the sun. The next phase will be less straightforward. A solar panel produces electricity during daytime, while the grid has to function around the clock. The hours when solar generation begins to fall are often the hours when electricity demand starts rising.
That makes energy storage more than an accessory to solar power. It could determine how much of the electricity system solar can ultimately supply. On this scenario, India Energy & Climate Center (IECC), examines whether solar power paired with batteries can provide electricity with the reliability expected from conventional thermal generation. The study uses the recently concluded Solar Energy Corporation of India (SECI) firm renewable energy tender as its benchmark.
During the day, solar electricity meets immediate demand while charging batteries with surplus power, which can then be discharged after sunset, turning intermittent generation into electricity available when it is needed.
Instead of asking developers to supply renewable electricity whenever it is available, the contract imposes delivery requirements across different parts of the day. The requirement rises to at least 90 per cent during six peak hours, falls to 50–60 per cent during solar hours and remains at 70 per cent during the other hours. A shortfall attracts a penalty of 1.5 times the contracted tariff.
Therefore, to make solar power more efficient, the focus shifts from selling sunshine to selling firm electricity.

The Battery is What Makes That Possible
The IECC researchers modelled what it would take to meet this obligation using solar and batteries. They tested 64 combinations of solar and storage across ten states, using ten years of weather data from 2015 to 2024. The solar capacity tested ranged from 2.5 GW to 6 GW, while battery storage ranged from 6 GWh to 24 GWh for a 1 GW grid connection.
The result shows something simple: solar power alone is not enough — batteries are doing a lot of the heavy lifting. To supply just 1 GW of steady electricity, the model suggests you would actually need about 3 GW worth of solar panels and a large battery system that can store 12 GWh of electricity.
With this setup, electricity could be supplied at around ₹5.15 per unit (kWh). In the real government auction, companies agreed to sell it at a very similar price of ₹5.25–₹5.26 per unit. In simple terms, this means solar power becomes reliable and usable at all hours only when it is backed by large batteries — and the cost is already close to what the market is willing to pay.
Why is Coal the Immediate Option?
Coal has traditionally been valuable to the electricity system not merely because it generates power, but because it can generate it on demand, with India’s coal fleet still supplying roughly 70–75% of the country’s electricity in recent years. Batteries begin to close this gap by decoupling the time of generation from the time of consumption, effectively shifting daytime solar energy into the evening peak window, which in India typically occurs between 6 pm and 10 pm when demand remains high but solar output has already declined.
This is also why the amount of storage required cannot be understood without looking at India’s climate.
How Does India and Europe Has Different Solar Problem?
Solar storage is often discussed as if the problem were identical everywhere. But India has a structural advantage in this respect. In Germany or Britain, solar generation varies substantially between summer and winter. A storage system designed to compensate for that seasonal decline would have to deal with periods far longer than a single night.
India’s solar resource behaves differently. The IECC study found that, across its ten years of data, India’s lowest monthly solar output was about 76 per cent of the ten-year monthly average. Annual generation varied by only about 4.5 per cent. By comparison, the study notes that December solar generation in Germany can be only 9–18 per cent of June’s output, while Britain’s can be 10–15 per cent.
India’s central storage problem is largely daily rather than seasonal. Batteries do not necessarily have to carry electricity through an entire winter. They need to carry it through the night. But India’s climate has another complication: the monsoon.
The Monsoon is the Weak Point
Cloudy periods create a double problem. The Rajasthan simulation found that June to September accounted for 56 per cent of the decade’s shortfall. August was the weakest month, with the average shortfall reaching 65 GWh, or 13 per cent of the month’s requirement. In the worst year, it reached 24 per cent.

The pattern changes across the country. In Gujarat, Madhya Pradesh, Karnataka, Kerala, Telangana and Maharashtra, 70–79 per cent of the simulated shortfall occurred during the June–September monsoon. In Kerala, a coastal state with heavy southwest monsoon cloud cover, the shortfall is also concentrated in June–September, with occasional spillover into October–November. Tamil Nadu had a different seasonal weakness, with November and December emerging as its most difficult months because of the northeast monsoon. Haryana’s weakest period was January.
So while India may not need the kind of seasonal storage required in northern Europe, it cannot treat solar generation as uniform throughout the year. The model puts the least-cost solar-plus-storage system at ₹4.93 per kWh in Jammu and Kashmir, ₹5.15 in Rajasthan and ₹5.22 in Gujarat. Tamil Nadu comes in at ₹5.41, while Maharashtra is at ₹5.58. The latter states require more solar capacity to maintain the same level of supply through periods of weaker sunlight.
The battery, in other words, is only one part of the equation. Where and when solar electricity is generated determines how hard the battery has to work.
Climate Question or Power-price Question
The economic case could strengthen as batteries become cheaper. The researchers estimate that every $10/kWh reduction in battery system cost would lower the modelled Rajasthan tariff by about ₹0.28 per kWh. At battery costs of $60–65/kWh, the same configuration could approach ₹4.3–₹4.4 per kWh under the study’s assumptions.
The study points to green steel, data centres and continuous industrial loads such as aluminium as potential users of firm renewable power.
While the results are modelled rather than drawn from long-term commercial operation and depend on assumptions about costs, financing and efficiency, policy is already moving in the same direction. India is no longer treating batteries as experimental add-ons; it is procuring them at scale. The SECI firm renewable energy tender is explicitly storage-linked, and states such as Rajasthan, Gujarat, Maharashtra and Tamil Nadu are issuing or planning multi-gigawatt bids that bundle solar with batteries to meet evening demand. Together, these tenders signal a rapidly expanding pipeline of storage-backed capacity requiring large-scale investment as the system shifts from buying daytime electricity to buying dispatchable power.












Sustainable Energy
India’s Clean Energy Research May Not Be Keeping Pace with Its Manufacturing Ambitions, Finds Study
A study of India’s publicly funded clean-energy research examines whether investments in solar power, batteries and other technologies are aligned with the country’s ambitions for domestic manufacturing and technological development.
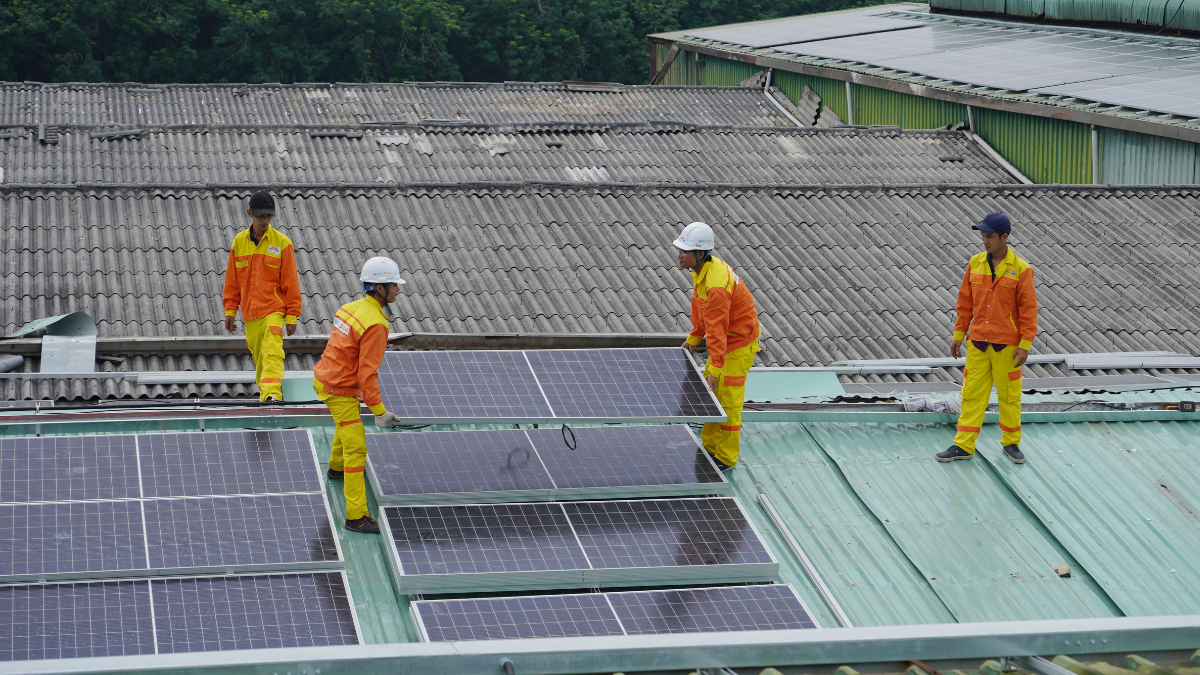
India’s public investment in clean-energy research is concentrated in established technologies, while funding for manufacturing innovation and large-scale technology development remains a challenge, according to a new study examining the country’s publicly funded research, development and demonstration (RD&D) activities.
The report, How Can India Align Its Clean Energy Innovations with Its Ambitions? An Assessment of Public RD&D Investments and Activities, by the Sustainable Futures Collaborative (SFC) and the Climate Policy Lab at Tufts University, maps 1,359 publicly funded clean-energy projects active or initiated between the financial years 2019 and 2024.
The projects span more than 90 institutions and account for approximately ₹1,443 crore in declared funding. The study finds that India has developed a substantial public research portfolio, but raises questions about whether its funding structures and research priorities are sufficiently aligned with the country’s ambitions for domestic manufacturing and technological leadership.
The findings echo concerns raised in other research on India’s clean-energy supply chains and innovation financing. Together, these studies highlight a challenge that extends beyond funding scientific research: ensuring that promising technologies can progress from laboratory development to demonstration, competitive manufacturing and commercial deployment.
Solar and storage dominate the research landscape
Renewable energy accounts for a substantial share of the mapped research portfolio. The SFC–Tufts study identifies 421 renewable-energy projects receiving approximately ₹580 crore, while another 333 projects in other power and energy-storage technologies account for around ₹492 crore.
Solar photovoltaic technology alone received approximately ₹401 crore across 234 projects, making it a major focus of public clean-energy research.
The portfolio also includes research on batteries, hydrogen, electric mobility, energy efficiency and carbon capture, utilisation and storage. However, the distribution of projects and funding varies across these areas, with electric mobility receiving less attention than solar energy, batteries and hydrogen.
The concentration of research in established technologies reflects India’s immediate clean-energy priorities. Solar power and battery storage are central to expanding renewable electricity and managing its intermittency. Research that improves the performance, reliability and affordability of these technologies can contribute directly to deployment.
India’s operating conditions also create specific research requirements. High temperatures, dust, humidity, price-sensitive demand and constraints in accessing materials and equipment can make technologies developed elsewhere less suitable without adaptation. Research into battery thermal management, solar-module degradation and affordable charging infrastructure can help technologies perform more effectively under Indian conditions.
However, the report argues that research addressing immediate deployment needs must also be considered alongside the longer-term development of domestic manufacturing capabilities and new technological solutions.
Incremental innovation dominates public funding
One of the study’s central findings is that approximately 81 per cent of the mapped projects can be classified as incremental innovations. These projects primarily seek to improve or adapt technologies that are already commercially established.
Such research is not necessarily a weakness. Incremental improvements can reduce costs, improve efficiency and make technologies more reliable in local conditions. The concern is whether the existing portfolio provides sufficient support for other forms of innovation needed to strengthen manufacturing and develop technological leadership.
The report finds that deployment-and-diffusion projects account for approximately 53 per cent of projects and 64 per cent of declared funding. Technology-leadership projects represent around 14 per cent of projects and 15 per cent of funding.
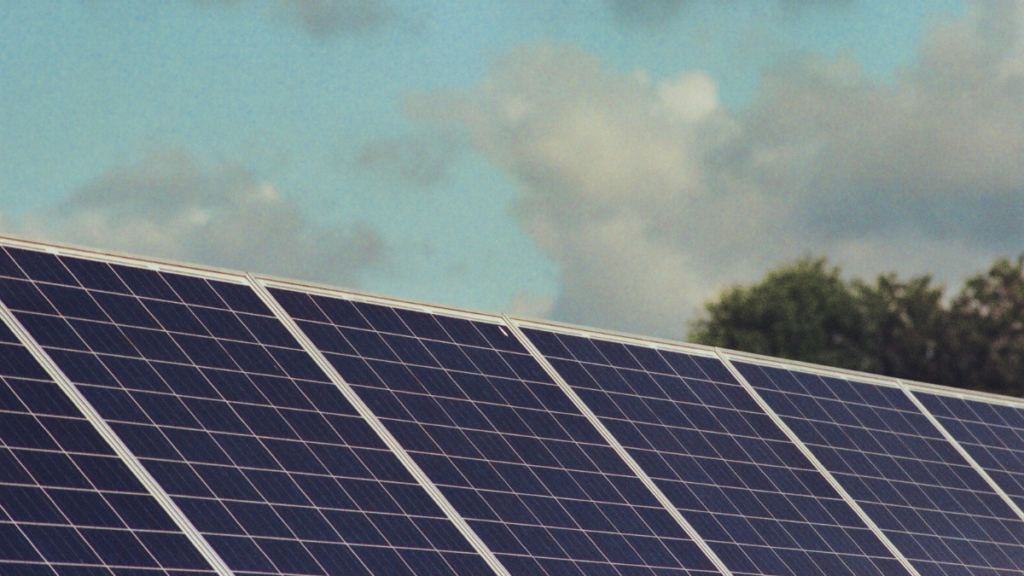
Solar panels under the backdrop of a clear sky.Image credit:Pexels
Process-oriented research receives a smaller share. Projects classified under manufacturing competitiveness account for approximately 28 per cent of projects and 18 per cent of funding, while projects targeting major changes in production processes represent around 5 per cent of projects and 3 per cent of funding.
A 2024 report by the Council on Energy, Environment and Water (CEEW), Strengthening India’s Clean Energy Supply Chains, examines manufacturing competitiveness across solar photovoltaics, wind turbines and lithium-ion batteries. It explores the supply-chain segments that matter for developing domestic industrial capabilities.
Read alongside the SFC–Tufts assessment, the CEEW report provides a broader perspective on the challenge of connecting research priorities with the industrial capabilities needed to manufacture clean-energy technologies in India.
Small grants and fragmented funding pose challenges
The SFC–Tufts study also highlights the size and distribution of research grants.Around 68 per cent of projects with declared budgets receive less than ₹50 lakh each. The median project size across technology categories ranges from approximately ₹33 lakh to ₹39 lakh.
These grants can support investigator-led research, early-stage experiments and improvements to existing technologies. However, projects involving pilot manufacturing, demonstration facilities, process development and commercial-scale validation may require different funding arrangements and substantially larger investments.
The report identifies differences in the funding approaches of government institutions. The Department of Science and Technology accounts for more than half of the mapped projects, reflecting its support for a large number of investigator-led grants. The Ministry of New and Renewable Energy supports fewer projects through comparatively larger programmes.
The study also finds that the 20 leading institutions account for close to 70 per cent of mapped projects.
These patterns matter because clean-energy innovation involves several stages, from scientific research and engineering to manufacturing, testing and commercial deployment. A funding structure suited to an early-stage research project may not be sufficient for a technology approaching industrial use.
An earlier CEEW study, Financing Clean Energy Innovation, examined the financing challenges associated with advancing clean-energy innovations. Its focus on financing complements the SFC–Tufts report’s emphasis on funding structures and the need to support different stages of technological development.
Technologies may require continued support after the initial research phase, particularly when they need to be demonstrated, tested and refined before becoming commercially viable. If funding does not adequately cover these stages, innovations can struggle to move from technical promise to market adoption.
Aligning research with industrial priorities
India already has policy mechanisms intended to promote clean-energy research and technology development. The Ministry of New and Renewable Energy’s Renewable Energy Research and Technology Development Programme includes objectives related to indigenous technology development, cost reduction, demonstration and collaboration with industry.
The question, therefore, is not simply whether India funds clean-energy research, but whether its research portfolio and funding mechanisms are appropriately structured to meet different objectives.
The SFC–Tufts report recommends clearer priorities across three broad goals: accelerating the deployment of existing technologies, strengthening domestic manufacturing competitiveness and developing technological leadership in emerging areas.
The study has limitations. Budget information was unavailable for around 16 per cent of mapped projects, while start-year information was missing for approximately 39 per cent. Private-sector innovation also falls outside its scope. Its findings therefore reflect the publicly documented research portfolio, rather than the entirety of India’s clean-energy innovation ecosystem.
Nevertheless, the findings raise an important policy question as India pursues both clean-energy deployment and domestic manufacturing: whether public research investment is supporting the entire journey from scientific discovery and technological improvement to competitive production and commercial scale.
The challenge is not simply to fund more research. It is to ensure that promising research can progress into technologies that India can manufacture, improve and deploy at scale.
Sustainable Energy
India Tightens CAFE Norms as Fuel Demand and Car Sales Rise
India’s new CAFE norms tighten fleet fuel-efficiency targets from 2027, with implications for petrol cars, hybrids, EVs and the country’s oil demand.

India will make carmakers meet stricter fuel-efficiency targets from April 2027, as the country tries to contain fuel consumption from a growing passenger-vehicle market. The new Corporate Average Fuel Economy (CAFE) norms will apply from April 1, 2027, to March 31, 2032. The fleet-average fuel-consumption target will fall from 3.996 litres per 100 km in 2027–28 to 3.3273 litres per 100 km in 2031–32.
That is a 16.7% improvement in the regulatory benchmark over the five-year period. The change matters because India’s demand for road fuel is rising while the country continues to import more than 90% of the crude oil it uses. Cars that consume less fuel can reduce the amount of petrol and diesel needed to keep the growing vehicle fleet on the road.
The new rules also give manufacturers more room to use electric vehicles, hybrids, alternative fuels and other efficiency technologies to meet their targets.
CAFE Norms: Why India Needs to Use Less Fuel
India’s passenger-vehicle market has changed considerably over the past decade. SUVs and larger cars have become more common, while overall vehicle ownership continues to rise. Every additional petrol or diesel vehicle adds to fuel demand. A more fuel-efficient fleet can slow that increase, even when the number of vehicles continues to grow.
The country’s dependence on imported crude makes this particularly relevant. India imports more than 90% of its crude oil, so higher oil consumption also means greater exposure to international oil prices and supply disruptions. The Bureau of Energy Efficiency introduced CAFE standards in 2017 with three objectives: reduce fuel consumption, lower carbon dioxide emissions and reduce dependence on imported oil. The latest notification tightens those requirements for the next five years.
CAFE: Not Same Mileage Target for Every Car
CAFE works differently from a rule that says every vehicle must deliver a particular number of kilometres per litre. It measures the average fuel consumption of a manufacturer’s passenger-vehicle fleet. The calculation takes sales volumes and vehicle weight into account. A company selling fuel-hungry SUVs, for instance, can improve its fleet average by selling more efficient cars, hybrids or electric vehicles.
That gives manufacturers several ways to meet the requirement. They can improve engines and transmissions, reduce energy losses, introduce hybrid systems, sell more EVs or use technologies that receive concessions under the CAFE framework.
What does the 16.7% Improvement Mean?
The 16.7% figure refers to the regulatory fleet benchmark. It does not mean that every new car will use 16.7% less petrol or diesel. Actual fuel consumption depends on the vehicle and how it is driven. Traffic, road conditions, speed, air-conditioning use and driving behaviour all affect mileage. The target applies to the manufacturer’s fleet as a whole.
The new framework also changes the vehicle-weight calculation. The reference weight will rise from 1,082 kg to 1,229 kg. The target curve has been revised so that heavier vehicles face greater efficiency requirements than lighter ones. That change is relevant to India’s passenger-vehicle market, where larger SUVs now account for a substantial share of sales.
Why EVs can Help Manufacturers Meet CAFE Targets
Electric vehicles have a direct advantage under a fuel-economy regulation because they do not consume petrol or diesel.
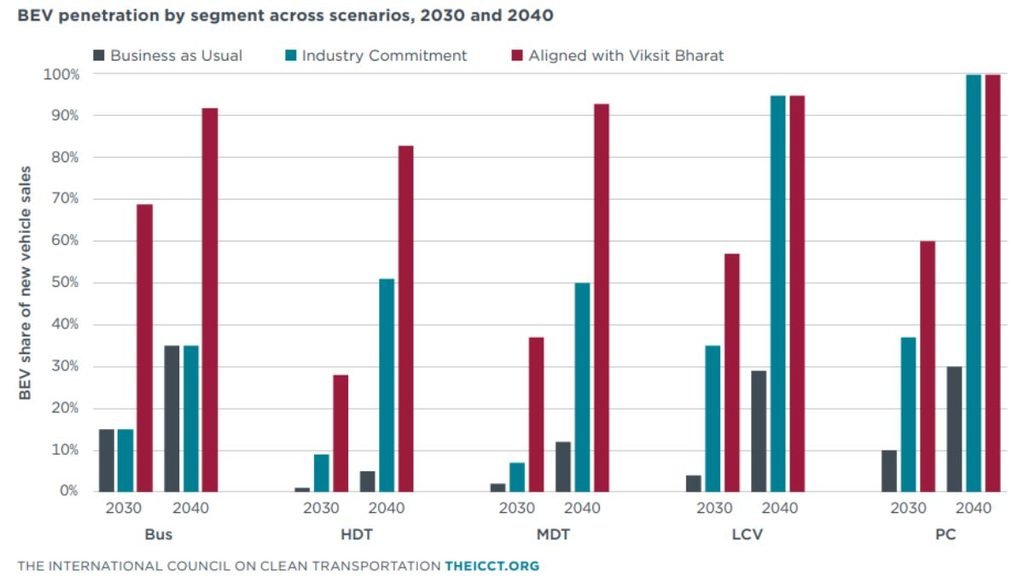
A manufacturer can therefore improve its fleet-average performance by increasing the share of EVs it sells. Hybrids can also reduce the average fuel consumption of a fleet.
The International Council on Clean Transportation (ICCT) has examined this relationship in its latest study of India’s vehicle market. Its 2026 analysis finds that stronger fuel-economy standards can support faster EV adoption and reduce oil consumption when the two policies move together. There is some evidence from India’s earlier CAFE rules as well.
An ICCT assessment of CAFE Phase II found that manufacturers relying on conventional efficiency improvements or CNG had difficulty meeting the targets. Manufacturers with significant EV sales, including Tata and MG, were able to meet the requirements with larger margins. The experience shows how a fleet standard can influence the technology choices made by manufacturers.
Stronger Standards Could Reduce Oil Demand
ICCT’s latest study models India’s road-transport oil demand under several policy pathways through 2040. In its business-as-usual scenario, road-transport oil consumption reaches about 197 million tonnes of oil equivalent (Mtoe) in 2040. An alternative scenario combines stronger fuel-efficiency standards with faster EV adoption. Under that pathway, oil consumption is about 146 Mtoe in 2040.
The difference is roughly 51 Mtoe. These are modelled scenarios, not forecasts. They show the scale of the difference that could emerge if India combines tighter efficiency rules with faster electrification. For India, lower oil demand would also reduce the amount of crude that has to be imported to supply road transport.
Technologies Beyond EVs
Electric vehicles are only one part of the new framework. The norms recognise 12 fuel-conservation technologies, compared with four under the earlier framework. These include technologies such as high-efficiency air-conditioning systems, advanced glazing and solar-reflective paints.
Each eligible technology can receive a concession of 1 gram of CO₂ per kilometre, subject to a maximum of 9 grams of CO₂ per kilometre. The framework also includes a Carbon Neutrality Factor for ethanol-blended petrol, biofuels and compressed biogas. This allows manufacturers to use a wider combination of technologies and fuels when working towards their fleet targets.
Super Credits Could Shape How Manufacturers Respond
The rules provide additional regulatory benefits for battery-electric vehicles, range-extended EVs, plug-in hybrids, strong hybrids and flex-fuel vehicles through volume derogation factors and super credits. These mechanisms give low-emission vehicles greater weight in the compliance calculation.
There is a trade-off, however. ICCT’s latest analysis points out that generous super credits can allow manufacturers to meet fleet targets with a relatively small share of EVs while continuing to sell less-efficient combustion-engine vehicles. That makes the treatment of these credits important as EV sales increase.
What Manufacturer Misses the Target?
The rules give companies several ways to manage compliance. Manufacturers can operate within two- or three-year compliance blocks. Credits can be carried forward, traded or exchanged. The Bureau of Energy Efficiency will also operate a buyout mechanism.
The system therefore gives manufacturers some flexibility in how they meet the target. It also means the effect of the regulation may not be visible in a single year’s sales figures.
Will Consumers Notice the Change?
Some changes could be visible in the showroom. Manufacturers may introduce more efficient petrol engines, expand hybrid offerings or increase the number of EVs in their portfolios. Other changes, such as improvements to air-conditioning systems or vehicle design, may be harder for buyers to notice.
The immediate effect on fuel bills is less straightforward. A regulatory improvement of 16.7% cannot be translated directly into a 16.7% saving for a driver. CAFE is calculated across a manufacturer’s fleet, while real-world mileage varies from one vehicle and driver to another. Its effect is likely to appear gradually as new vehicles replace older ones.
CAFE: One Part Larger Transport Shift
Tighter fuel-efficiency standards can reduce the amount of fuel consumed by each vehicle. They do not determine how many vehicles people buy or how much they drive. Public transport, urban planning, vehicle electrification and the availability of alternative fuels will also influence India’s future oil demand.
For the automobile industry, however, the direction is clear. The average efficiency of the vehicles sold in India will have to improve over the next five years. The new CAFE norms give manufacturers several routes to get there. They can make combustion engines more efficient, sell more hybrids and EVs, use recognised fuel-saving technologies or combine these approaches. For India, the reason for tightening the rules is straightforward. More vehicles on the road do not have to mean a matching increase in fuel consumption. The next five years will show how much the industry can narrow that gap.
Sustainable Energy
How Wind Turbines Could Produce More Power From the Same Wind
Researchers find that adjusting wind turbine blade speed when machines are misaligned with the wind could help increase power output from existing turbines.


How Scientists Traced the Flow of Matter Around a Dead Star Using X-rays

India Scores Just 2 Out of 32 for Integrating Health into Climate Commitments

Global Job Market Faces a Growing Inclusion Gap as AI and Digitalisation Reshape Work

FSSAI Moves to Restrict Added Sugars in Infant Foods, Citing Need for Stronger Nutritional Safeguards

NMC Directs Medical Colleges to Set Up Patient Safety Committees

From Scams to Screens: How the National Stock Exchange Rewrote India’s Equity Story

Knowing When to Think for Ourselves: AI, Intuition and the Education of Discernment

After a Scorching Summer, Delhi’s Children Are Slow to Return Outdoors

Two Chemists Win Nobel Prize for Solving a Century-Old Puzzle: Why Life Picks One Hand Over the Other

India’s AI Moment Rests on More Than Code

-

 Math3 months ago
The 2026 Fields Medals: Four Proofs, Four Decades-Old Problems Solved
-
EP Deep Dive: Data & Solutions3 months ago
After Kerala’s Deadliest Landslide, the Hardest Thing to Rebuild Was Childhood
-
EP Deep Dive: Data & Solutions4 months ago
West Asia Crisis: Can Kerala’s Returning Gulf Migrants Find a Future in the Green Economy?
-
Space & Physics5 months ago
India Semiconductor Mission: ‘It’s Not About Fabs. It’s About Building An Entire Ecosystem’
-
Interviews4 weeks ago
From Scams to Screens: How the National Stock Exchange Rewrote India’s Equity Story
-
Climate5 months ago
The Climate World Cup? How Climate Change Could Affect Player Performance at the 2026 World Cup
-
Society3 months ago
What Is Civilisational Diplomacy? Understanding India’s Newest Foreign Policy Tool
-
Society4 months ago
From Bell Labs to the Classroom: A Second Career in Teaching