
Sustainable Energy
Can India Finally Turn Waste Into Fuel? INR 23,731-Crore CBG Push
India invests INR 23,731 crore on compressed biogas (CBG) to reduce fossil-fuel dependence, manage organic waste and strengthen energy security. With 217 plants commissioned and 339 under construction as of August 2026, the new GOBARdhan scheme aims to scale production nearly ten-fold—but can it overcome the infrastructure and feedstock challenges that have slowed the sector so far?

India is putting INR 23,731 crore behind an effort to make compressed biogas (CBG) a larger part of its energy system, with the government targeting nearly ten-fold growth in domestic CBG production by 2035-36. The GOBARdhan scheme will combine assured demand, price support, capital assistance, pipeline connectivity and credit guarantees to expand the industry.
The push comes as India remains heavily dependent on imported gas. The government says nearly 50% of the country’s natural gas requirement is met through imports, while about 55–60% of India’s LNG imports pass through the Strait of Hormuz. This dependence makes domestically produced alternatives more relevant to energy security.
From 5,000 Plants to 217
India’s CBG ambitions are not new. The Sustainable Alternative Towards Affordable Transportation (SATAT) initiative, launched in 2018, envisaged 5,000 CBG plants producing 15 million tonnes annually by 2023-24. The target was missed.
The sector has nevertheless grown. As of August 6, 2026, 1,908 CBG/Bio-CNG plants were registered, of which 217 had been commissioned and another 339 were under construction.
The numbers show both progress and the scale of the challenge: only a fraction of registered projects have reached operation, while hundreds remain under construction.
What is Different This Time?
The new scheme attempts to address one of the industry’s central problems: making CBG projects financially predictable.
City Gas Distribution companies will face a CBG blending obligation of 3% in 2026-27, 4% in 2027-28 and 5% from 2028-29 for CNG transport and domestic PNG. The government will also provide an administered CBG price of INR 2,110 per MMBTU, with a minimum ten-year horizon. Eligible greenfield projects can receive capital assistance of up to INR 2 crore per tonne per day of installed capacity.

The scheme also provides pipeline support and a credit guarantee mechanism, aimed at reducing infrastructure and financing barriers.
In other words, the government is trying to create not just more plants, but a predictable market for the gas those plants produce.
Where is the Industry Growing?
CBG development remains concentrated geographically. Uttar Pradesh is among the leading states, while Gujarat, Haryana, Karnataka and Maharashtra also have significant numbers of projects. The new scheme could allow these existing hubs to expand while opening opportunities in states with large agricultural and municipal-waste streams but limited CBG infrastructure.
Kerala illustrates the latter challenge. The state recently moved into the sector with the Brahmapuram CBG plant in Kochi, commissioned in February 2026 and designed to process 150 tonnes of source-segregated biodegradable municipal waste every day.
This points to one of CBG’s central propositions: waste that would otherwise require disposal can become both fuel and a source of organic manure.
The Waste-to-Energy Opportunity
CBG can be produced from agricultural residue, cattle dung, press mud and biodegradable municipal waste. The process also generates organic fertiliser, potentially creating an additional revenue stream for producers.
But the availability of biomass alone does not guarantee a viable plant. Feedstock must be collected, transported, stored and supplied consistently. This is particularly important for agricultural residues, which are seasonal and geographically dispersed.
The new scheme therefore includes provisions for feedstock mapping and aggregation infrastructure, alongside a district-level challenge fund.
What Does the Government Expect?
The government estimates that the scheme could displace 10 million tonnes of fossil fuel over the next decade and generate around 40,000 crore rupees in foreign-exchange savings. It projects an additional 75,000 crore rupees contribution to GDP, more than 1.5 lakh jobs, over 40 million tonnes of CO₂-equivalent emissions avoided, and production of more than 250 million tonnes of organic fertiliser. These are government projections, not realised outcomes.
The projections underline the government’s broader ambition: CBG is being positioned not simply as an alternative fuel, but as a link between energy security, waste management, agriculture, employment and emissions reduction.
The Implementation Test
India now has a growing pipeline of CBG projects, a policy-backed market and financial incentives. But its earlier experience shows that ambitious targets do not automatically translate into operational plants. The success of GOBARdhan will ultimately depend on whether developers can secure reliable feedstock, obtain financing, connect plants to gas markets and operate them sustainably.
India has no shortage of organic waste. The challenge is turning that resource into a reliable, commercially viable and geographically widespread source of renewable gas.












Sustainable Energy
India Tightens CAFE Norms as Fuel Demand and Car Sales Rise
India’s new CAFE norms tighten fleet fuel-efficiency targets from 2027, with implications for petrol cars, hybrids, EVs and the country’s oil demand.

India will make carmakers meet stricter fuel-efficiency targets from April 2027, as the country tries to contain fuel consumption from a growing passenger-vehicle market. The new Corporate Average Fuel Economy (CAFE) norms will apply from April 1, 2027, to March 31, 2032. The fleet-average fuel-consumption target will fall from 3.996 litres per 100 km in 2027–28 to 3.3273 litres per 100 km in 2031–32.
That is a 16.7% improvement in the regulatory benchmark over the five-year period. The change matters because India’s demand for road fuel is rising while the country continues to import more than 90% of the crude oil it uses. Cars that consume less fuel can reduce the amount of petrol and diesel needed to keep the growing vehicle fleet on the road.
The new rules also give manufacturers more room to use electric vehicles, hybrids, alternative fuels and other efficiency technologies to meet their targets.
CAFE Norms: Why India Needs to Use Less Fuel
India’s passenger-vehicle market has changed considerably over the past decade. SUVs and larger cars have become more common, while overall vehicle ownership continues to rise. Every additional petrol or diesel vehicle adds to fuel demand. A more fuel-efficient fleet can slow that increase, even when the number of vehicles continues to grow.
The country’s dependence on imported crude makes this particularly relevant. India imports more than 90% of its crude oil, so higher oil consumption also means greater exposure to international oil prices and supply disruptions. The Bureau of Energy Efficiency introduced CAFE standards in 2017 with three objectives: reduce fuel consumption, lower carbon dioxide emissions and reduce dependence on imported oil. The latest notification tightens those requirements for the next five years.
CAFE: Not Same Mileage Target for Every Car
CAFE works differently from a rule that says every vehicle must deliver a particular number of kilometres per litre. It measures the average fuel consumption of a manufacturer’s passenger-vehicle fleet. The calculation takes sales volumes and vehicle weight into account. A company selling fuel-hungry SUVs, for instance, can improve its fleet average by selling more efficient cars, hybrids or electric vehicles.
That gives manufacturers several ways to meet the requirement. They can improve engines and transmissions, reduce energy losses, introduce hybrid systems, sell more EVs or use technologies that receive concessions under the CAFE framework.
What does the 16.7% Improvement Mean?
The 16.7% figure refers to the regulatory fleet benchmark. It does not mean that every new car will use 16.7% less petrol or diesel. Actual fuel consumption depends on the vehicle and how it is driven. Traffic, road conditions, speed, air-conditioning use and driving behaviour all affect mileage. The target applies to the manufacturer’s fleet as a whole.
The new framework also changes the vehicle-weight calculation. The reference weight will rise from 1,082 kg to 1,229 kg. The target curve has been revised so that heavier vehicles face greater efficiency requirements than lighter ones. That change is relevant to India’s passenger-vehicle market, where larger SUVs now account for a substantial share of sales.
Why EVs can Help Manufacturers Meet CAFE Targets
Electric vehicles have a direct advantage under a fuel-economy regulation because they do not consume petrol or diesel.
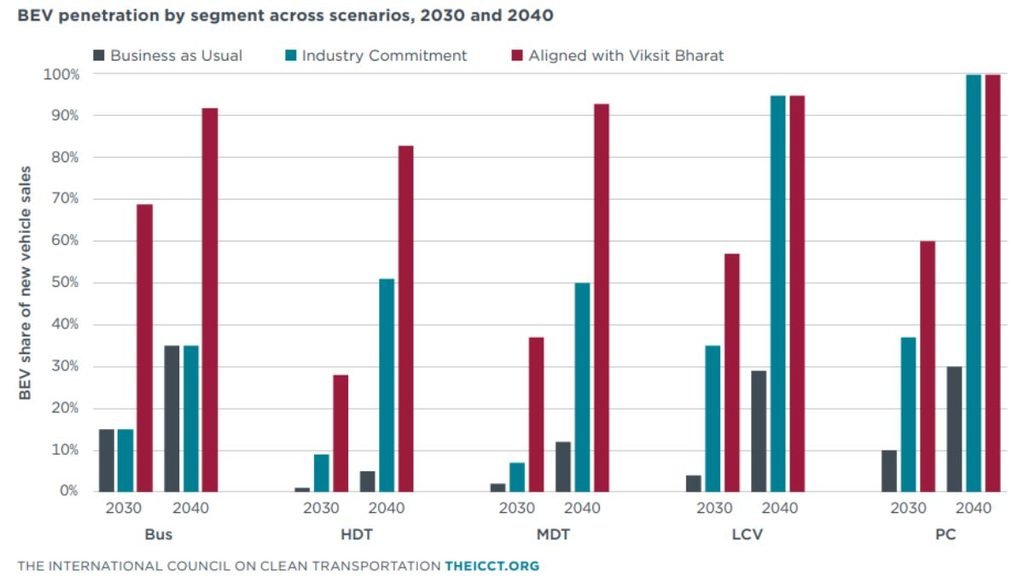
A manufacturer can therefore improve its fleet-average performance by increasing the share of EVs it sells. Hybrids can also reduce the average fuel consumption of a fleet.
The International Council on Clean Transportation (ICCT) has examined this relationship in its latest study of India’s vehicle market. Its 2026 analysis finds that stronger fuel-economy standards can support faster EV adoption and reduce oil consumption when the two policies move together. There is some evidence from India’s earlier CAFE rules as well.
An ICCT assessment of CAFE Phase II found that manufacturers relying on conventional efficiency improvements or CNG had difficulty meeting the targets. Manufacturers with significant EV sales, including Tata and MG, were able to meet the requirements with larger margins. The experience shows how a fleet standard can influence the technology choices made by manufacturers.
Stronger Standards Could Reduce Oil Demand
ICCT’s latest study models India’s road-transport oil demand under several policy pathways through 2040. In its business-as-usual scenario, road-transport oil consumption reaches about 197 million tonnes of oil equivalent (Mtoe) in 2040. An alternative scenario combines stronger fuel-efficiency standards with faster EV adoption. Under that pathway, oil consumption is about 146 Mtoe in 2040.
The difference is roughly 51 Mtoe. These are modelled scenarios, not forecasts. They show the scale of the difference that could emerge if India combines tighter efficiency rules with faster electrification. For India, lower oil demand would also reduce the amount of crude that has to be imported to supply road transport.
Technologies Beyond EVs
Electric vehicles are only one part of the new framework. The norms recognise 12 fuel-conservation technologies, compared with four under the earlier framework. These include technologies such as high-efficiency air-conditioning systems, advanced glazing and solar-reflective paints.
Each eligible technology can receive a concession of 1 gram of CO₂ per kilometre, subject to a maximum of 9 grams of CO₂ per kilometre. The framework also includes a Carbon Neutrality Factor for ethanol-blended petrol, biofuels and compressed biogas. This allows manufacturers to use a wider combination of technologies and fuels when working towards their fleet targets.
Super Credits Could Shape How Manufacturers Respond
The rules provide additional regulatory benefits for battery-electric vehicles, range-extended EVs, plug-in hybrids, strong hybrids and flex-fuel vehicles through volume derogation factors and super credits. These mechanisms give low-emission vehicles greater weight in the compliance calculation.
There is a trade-off, however. ICCT’s latest analysis points out that generous super credits can allow manufacturers to meet fleet targets with a relatively small share of EVs while continuing to sell less-efficient combustion-engine vehicles. That makes the treatment of these credits important as EV sales increase.
What Manufacturer Misses the Target?
The rules give companies several ways to manage compliance. Manufacturers can operate within two- or three-year compliance blocks. Credits can be carried forward, traded or exchanged. The Bureau of Energy Efficiency will also operate a buyout mechanism.
The system therefore gives manufacturers some flexibility in how they meet the target. It also means the effect of the regulation may not be visible in a single year’s sales figures.
Will Consumers Notice the Change?
Some changes could be visible in the showroom. Manufacturers may introduce more efficient petrol engines, expand hybrid offerings or increase the number of EVs in their portfolios. Other changes, such as improvements to air-conditioning systems or vehicle design, may be harder for buyers to notice.
The immediate effect on fuel bills is less straightforward. A regulatory improvement of 16.7% cannot be translated directly into a 16.7% saving for a driver. CAFE is calculated across a manufacturer’s fleet, while real-world mileage varies from one vehicle and driver to another. Its effect is likely to appear gradually as new vehicles replace older ones.
CAFE: One Part Larger Transport Shift
Tighter fuel-efficiency standards can reduce the amount of fuel consumed by each vehicle. They do not determine how many vehicles people buy or how much they drive. Public transport, urban planning, vehicle electrification and the availability of alternative fuels will also influence India’s future oil demand.
For the automobile industry, however, the direction is clear. The average efficiency of the vehicles sold in India will have to improve over the next five years. The new CAFE norms give manufacturers several routes to get there. They can make combustion engines more efficient, sell more hybrids and EVs, use recognised fuel-saving technologies or combine these approaches. For India, the reason for tightening the rules is straightforward. More vehicles on the road do not have to mean a matching increase in fuel consumption. The next five years will show how much the industry can narrow that gap.
Sustainable Energy
How Wind Turbines Could Produce More Power From the Same Wind
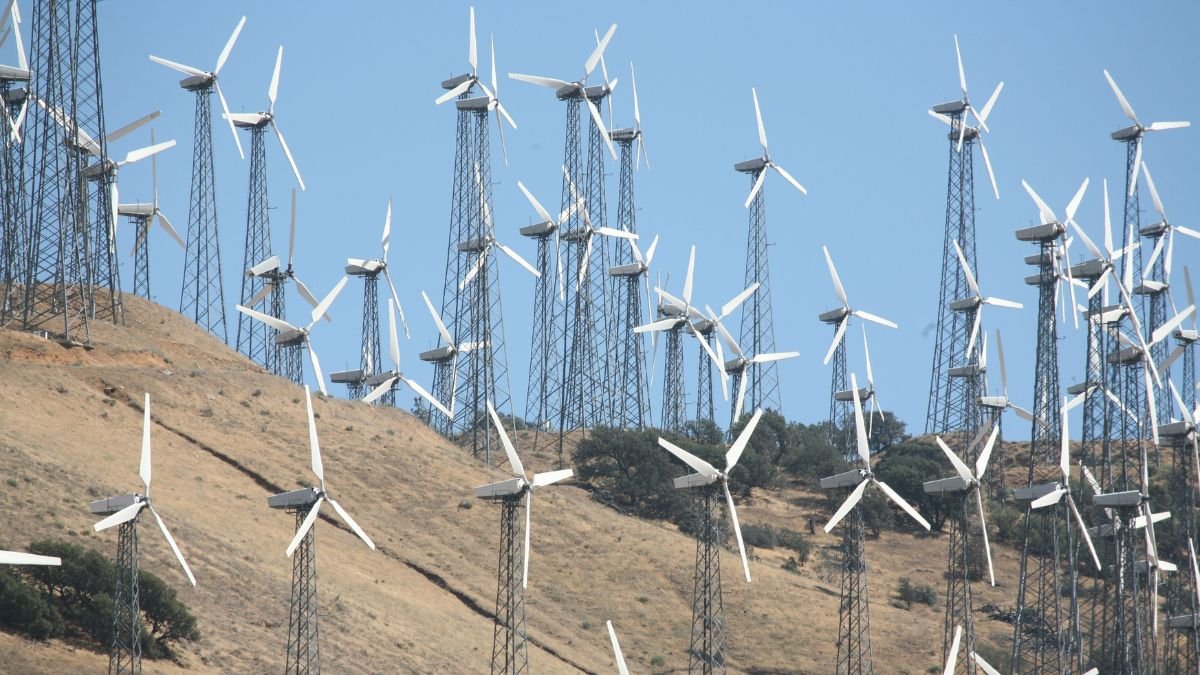
Researchers find that adjusting wind turbine blade speed when machines are misaligned with the wind could help increase power output from existing turbines.
Sustainable Energy
India’s Journey of Turning Organic Waste Into Energy. Can It Scale?
India generates more than 1.6 lakh tonnes of municipal waste every day. Across the country, organic waste is being turned into biogas, Bio-CNG, electricity and manure.
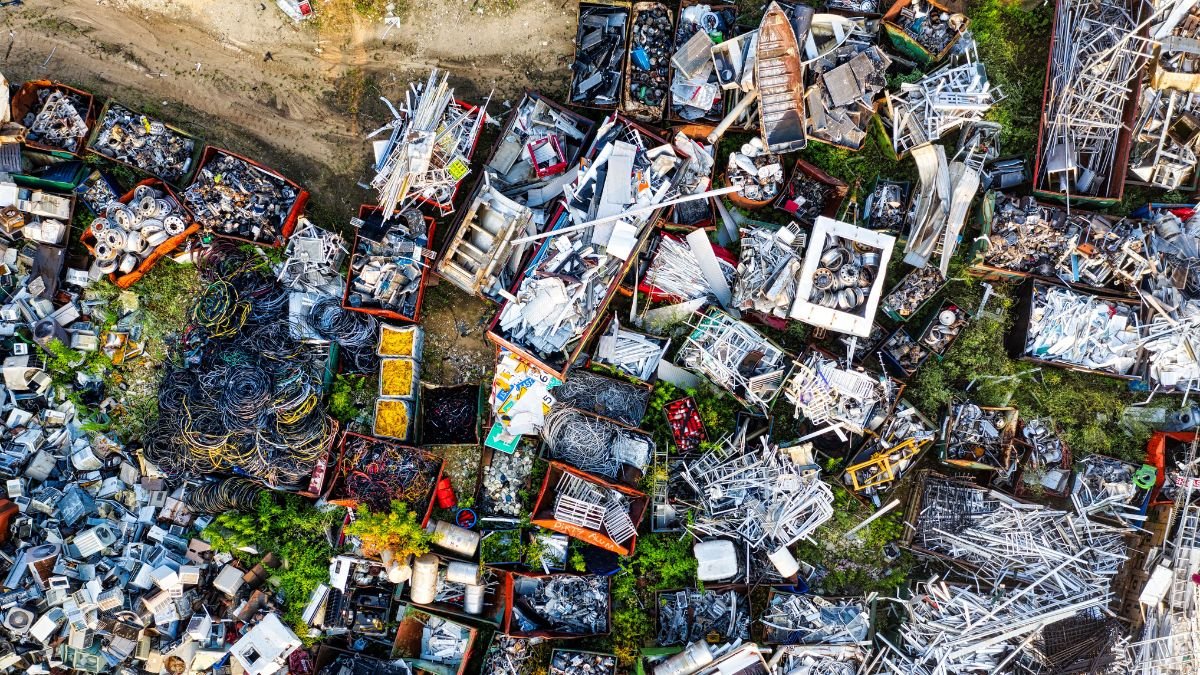
India’s cities generate about 1.62 lakh tonnes of municipal solid waste every day. Of this, around 1.32 lakh tonnes is processed, according to data reported by States and Union Territories on the Swachhatam portal in January 2026. That leaves more than 30,000 tonnes a day outside the reported processing stream.
The scale of the waste stream makes what happens to its biodegradable fraction important. Food scraps, vegetable and fruit waste, cattle dung and other organic material can either add to the disposal burden or be recovered for another use.
India’s new Solid Waste Management Rules, 2026, which came into force on April 1, make this distinction more explicit. They require waste to be separated at source into four streams, including wet waste. Kitchen waste, vegetables, fruit peels, meat and flowers are to be composted or processed through bio-methanation at the nearest facility.
Across India, projects are already using different organic waste streams to produce biogas, electricity, compressed biogas and manure. Their settings range from an educational campus and a vegetable market to a large cattle shelter and a city-scale Bio-CNG plant.
Campus that Replaced LPG with Biogas
At the Shrimati Manekba Vinay Vihar Educational Complex near Adalaj in Gujarat, the kitchen serves more than 500 people every day. Around 250 hostel students receive two meals a day, along with 15 staff families living on the campus.
The campus operates two biogas plants with a combined capacity of 90 cubic metres a day. They use dung from 222 cows kept at the institution’s cowshed, along with kitchen waste and agricultural residue from nearby fields.
The gas meets the campus’s entire cooking-fuel requirement. Without the plants, the campus would have needed around 30 LPG cylinders every month. The process also leaves behind slurry that can be used as organic fertiliser. The arrangement is relatively contained. The waste is generated within or close to the institution, and the resulting gas has a direct use on the same campus.
Vegetable Market Generating Its Own Power
At Bowenpally Vegetable Market in Hyderabad, roughly 10 tonnes of vegetable and fruit waste are collected every day. The waste was previously sent to landfills. An on-site biogas plant now processes nearly all of it. The plant generates around 400–500 units of electricity and 30 kg of biofuel every day. The electricity powers the market’s streetlights, stalls, administration building and water-supply network. The biofuel is used in the commercial kitchen.
The plant has reduced the market’s electricity bill by roughly half, from an earlier average of about ₹3 lakh a month. Five more plants have since been funded at other market yards. The project has also created work for women involved in waste sorting, machinery operation and administration. Here too, the waste source and the main users of the energy are concentrated in one location.
Prayagraj: Multiple Waste Streams Together
The Bio-CNG plant in Prayagraj operates at a much larger scale. It can process 343 tonnes of organic waste a day and produce around 21 tonnes of Bio-CNG. Its feedstock includes wet waste, paddy straw, cattle dung and poultry litter. The plant receives waste from hotels, restaurants and apartment complexes. Daily wet-waste supply has grown from around 7–8 tonnes initially to about 125 tonnes.
Along with Bio-CNG, the facility produces around 28 tonnes of compost each day, which is made available to local farmers. The gas supports city transport. The project is expected to extend piped gas access to around 45,000 households and reduce carbon emissions by approximately 57,000 tonnes annually.
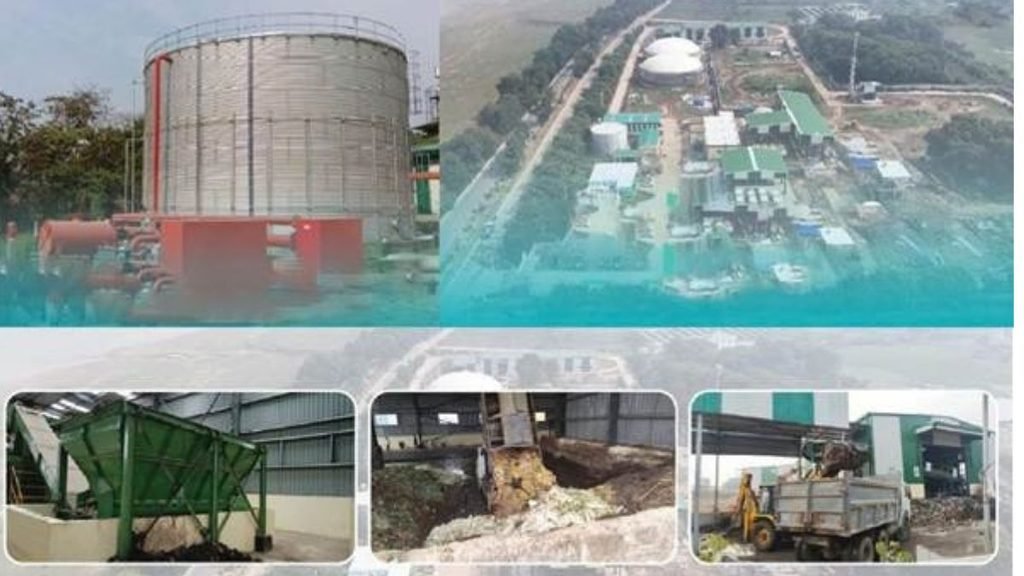
This is a different operating model from the smaller projects. Waste has to be brought in from multiple sources and supplied in sufficient quantities to keep a large facility running.
Gwalior Turns Cattle Dung Into Fuel
At Adarsh Gaushala in Laltipara, Gwalior, more than 10,000 cattle provide the main feedstock for a 100-tonne-per-day CBG plant. The ₹31-crore facility converts about 100 tonnes of cattle dung every day into two tonnes of compressed biogas. It also produces 10–15 tonnes of dry bio-manure daily.
The plant can process vegetable and fruit waste collected from markets and homes as well. The model is built around a large and concentrated source of organic material, with the resulting fuel and manure providing outlets for the products.
Waste Management: The Scale-up Problem Starts with the Waste
These projects demonstrate different ways of using organic waste. They also have conditions that are not automatically available across a city. The Gujarat campus has its own cowshed and kitchen. Bowenpally has a large quantity of similar waste concentrated in one market. Gwalior has access to thousands of cattle. Prayagraj draws from organised sources such as hotels, restaurants and apartment complexes.
Household waste presents a different problem. It is spread across thousands of locations and can contain plastics, glass and other contaminants. Recovering the organic fraction requires consistent segregation and collection. Moving it to a processing facility adds transport costs.
The plant itself is only one part of the system. A facility also needs a dependable supply of suitable feedstock. Once gas or electricity is produced, there must be a user or buyer. Compost and bio-manure need markets as well.
The 2026 rules place greater emphasis on this chain. Four-stream segregation is now mandatory, and bulk waste generators producing 100 kg or more of waste a day are required to ensure that their waste is collected, transported and processed properly. They must process wet waste on-site as far as possible or obtain an Extended Bulk Waste Generator Responsibility certificate where that is not feasible.
What the Projects Tell Us About Waste-to-energy
The four projects provide evidence of what can work when the waste stream, technology and end use are aligned. They do not establish that the same economics will apply across India’s urban areas.
The Bowenpally example, for instance, shows a substantial reduction in the market’s electricity bill, but the available account does not provide enough information on capital expenditure, operating costs or the time required to recover the investment. The same questions become more important as systems grow larger.
There is also a distinction between expected and demonstrated environmental benefits. The approximately 57,000-tonne annual carbon reduction cited for Prayagraj is an expected outcome, not a measured result reported in the source material. And the climate value of these systems cannot be judged only by what comes out of the plant. Collection, transport, processing and the energy source being replaced all form part of the calculation.
India’s waste figures show why the issue matters. More than 1.6 lakh tonnes of municipal waste enters the urban system every day, even as the country reports processing around 81% of it. The opportunity for organic waste lies in what happens before disposal becomes necessary. The challenge is making segregation, collection, processing and end-use work reliably enough for waste-to-energy to become part of that larger system.


Puberty, Pregnancy and Menopause Reshape the Female Brain Differently, Study Finds

PRASHAST: 72 Lakh Teachers Sensitised to Identify Children Who May Need Disability Support

Extreme Heat Threatens Pregnancies, Exposing Gaps in Climate Adaptation Plans

Centre Caps Trade Margins on Non-Scheduled Cancer Drugs at 30%

World Space Week 2026: How the Rocket Revolution Is Changing Space

From Scams to Screens: How the National Stock Exchange Rewrote India’s Equity Story

Aim for the Stars: Anjali Thomas’s Journey from a Small College in Kerala to the Frontiers of Medical Imaging

Two Chemists Win Nobel Prize for Solving a Century-Old Puzzle: Why Life Picks One Hand Over the Other

India’s AI Moment Rests on More Than Code

Marshall Islands: Why the US Nuclear Legacy Is Back Before the UN

-

 Math3 months ago
The 2026 Fields Medals: Four Proofs, Four Decades-Old Problems Solved
-
Climate2 months ago
After Kerala’s Deadliest Landslide, the Hardest Thing to Rebuild Was Childhood
-
Society3 months ago
West Asia Crisis: Can Kerala’s Returning Gulf Migrants Find a Future in the Green Economy?
-
Space & Physics4 months ago
India Semiconductor Mission: ‘It’s Not About Fabs. It’s About Building An Entire Ecosystem’
-
Interviews2 weeks ago
From Scams to Screens: How the National Stock Exchange Rewrote India’s Equity Story
-
Climate4 months ago
The Climate World Cup? How Climate Change Could Affect Player Performance at the 2026 World Cup
-
Society3 months ago
What Is Civilisational Diplomacy? Understanding India’s Newest Foreign Policy Tool
-
Society4 months ago
From Bell Labs to the Classroom: A Second Career in Teaching