
Sustainability
100% Access in China, 5% in South Sudan: The Global Electricity Gap
China has 100% electricity access, while South Sudan has just 5.4%. India and Nigeria show how access, consumption and demand reveal a deeper global electricity gap.


China and South Sudan are separated by more than 10,000 kilometres. They are also at opposite ends of the world’s electricity-access divide. In 2023, electricity access reached 100% of China’s population, compared with just 5.4% in South Sudan. India was at 99.5%, while Nigeria stood at 61.2%, according to World Bank data. This electricity gap sits along with global access rate was 91.6%.
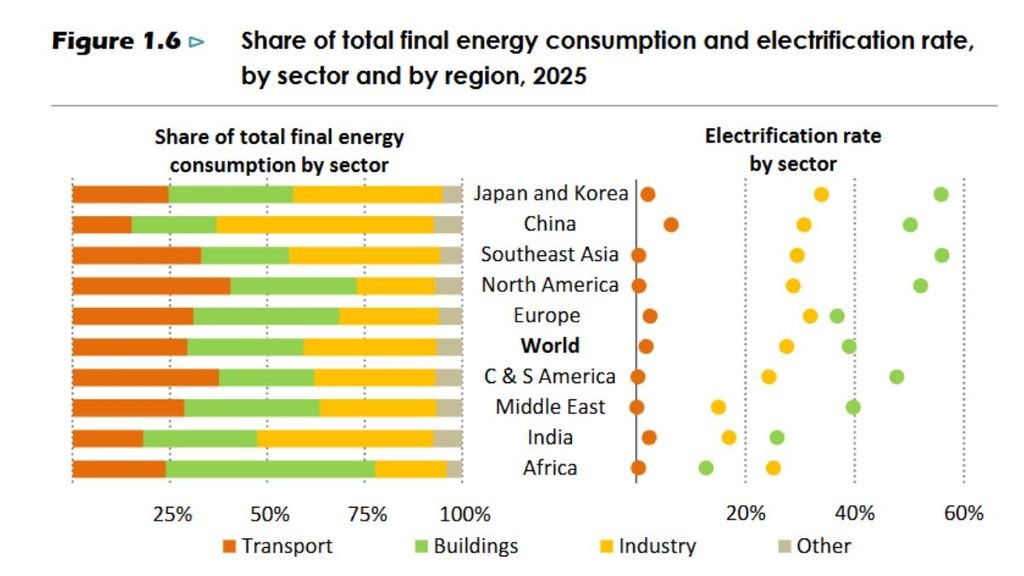
But access tells only part of the story. The International Energy Agency estimates that people in sub-Saharan Africa consume about 200 kilowatt-hours (kWh) of electricity per person each year, compared with around 7,000 kWh in advanced economies and China. Meanwhile, about 730 million people still lacked electricity access in 2025, more than 80% of them in sub-Saharan Africa.
At the other end of the spectrum, global electricity demand is rising rapidly. It grew by about 3% in 2025, more than twice as fast as total energy demand. China alone accounted for 58% of the increase, with its net electricity demand exceeding 9,500 TWh.
This is the contradiction at the heart of the world’s “Age of Electricity”: while some economies are preparing to run more of their cars, factories and buildings on electricity, hundreds of millions of people are still waiting for reliable access to basic services.
The Electricity Gap: One Transition
For countries with near-universal access, the next phase is largely about increasing electricity’s role in transport, buildings and industry. For countries with major access gaps, the priority remains connecting households and businesses and making that electricity reliable and affordable. The IEA’s figures show why these stages cannot be treated as a single global transition. Electricity can be a basic service in one economy and the backbone of an industrial and digital economy in another.
South Sudan: Access is Still the Challenge
South Sudan’s 5.4% electricity-access rate means roughly 95% of its population remained without access in 2023. The World Bank has identified it as having the world’s lowest national access rate. The problem is not simply a shortage of generating technology. Building electricity infrastructure in countries with weak grids, dispersed populations and difficult financing conditions is expensive. Off-grid and mini-grid systems are particularly important where conventional grid expansion cannot reach everyone quickly.
The IEA estimates that universal electricity access could be achieved around 2035 under an accelerated-access scenario. That would require about 80 million people gaining access every year, including around 70 million annually in sub-Saharan Africa.
The proposed mix is also revealing: about 45% of new connections through grids, 30% through mini-grids and 25% through solar home systems. The IEA estimates that this would require about $23 billion a year in investment.
Connecting everyone would add only about 160 TWh of electricity demand by 2035—around 0.6% of today’s global electricity demand. Sub-Saharan Africa would account for about 90 TWh of that increase. The constraint, therefore, is less about the world’s overall electricity supply than about investment, infrastructure, institutions and the ability to extend electricity to productive economic activity.
Nigeria: Not Simple Yes-or-No Question
Nigeria shows the next stage. About 61.2% of its population had electricity access in 2023. That leaves a large share of the population without electricity despite the country’s much larger electricity system and economy.
Extending access is only part of the challenge. Electricity becomes economically significant when it can reliably run irrigation pumps, refrigeration, machinery, communications and health services. The IEA describes these as productive uses that can increase incomes and help households afford electricity.
An electricity-access percentage can therefore hide an important part of the story. Being connected is not the same as having enough reliable electricity to participate fully in a modern economy.
India: Rapidly Changing Demand
India has largely crossed the first access barrier. World Bank data put electricity access at 99.5% in 2023, compared with 61.2% in Nigeria and 5.4% in South Sudan. Its challenge is increasingly about scale, timing and the source of electricity.
India’s electricity demand grew rapidly for much of the past decade. But 2025 was an exception: demand rose only 1.4%, after four consecutive years of growth above 6%. The IEA attributes much of the slowdown to an early, intense monsoon that reduced cooling demand and electricity use for agricultural pumping.
The IEA expects India’s electricity demand to grow by an average 6.4% a year between 2025 and 2030, adding more than 570 TWh to annual consumption. Cooling alone is expected to account for more than one-fifth of that growth.
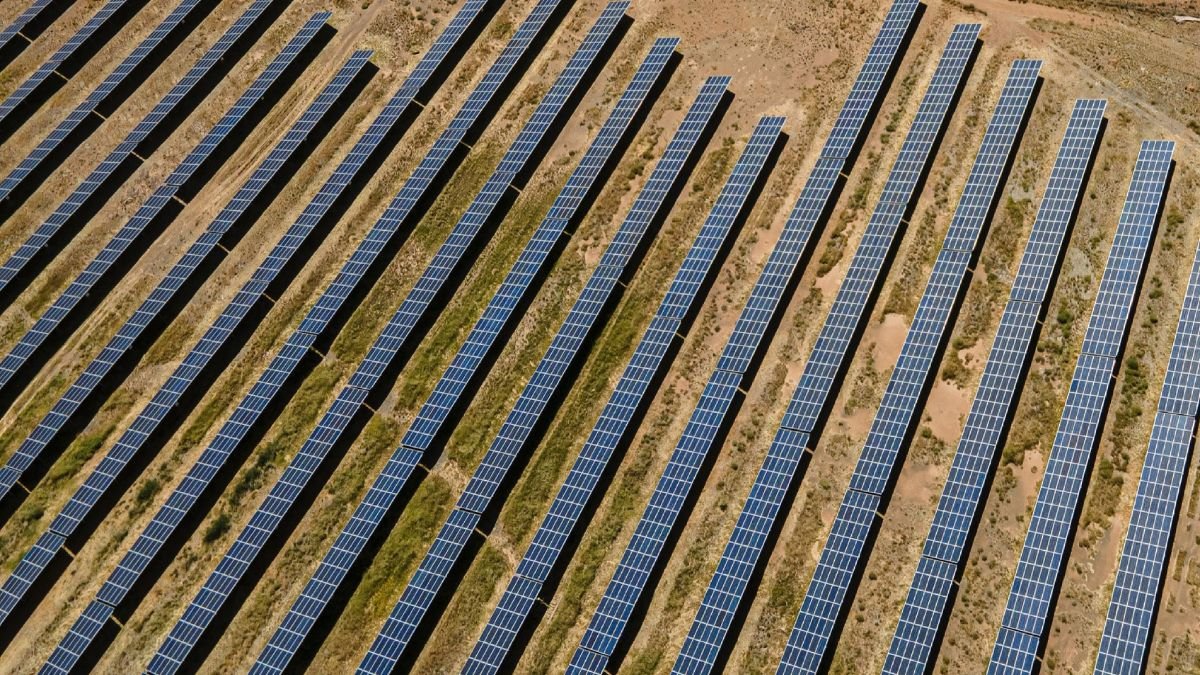
This creates a different set of infrastructure pressures. Solar generation peaks during daylight, while demand increasingly extends into the evening. Storage, flexible demand, electricity pricing and stronger grids become important. The IEA also identifies industrial electrification as an opportunity: nearly 30% of India’s industrial heat demand is below 150°C, where electric technologies can potentially replace fossil-fuel use.
China’s Electricity is Already the Backbone
China represents another stage. Electricity access is universal, but electricity demand is enormous. China’s net electricity demand exceeded 9,500 TWh in 2025, rising 5.1% from the previous year. China alone contributed 58% of global electricity-demand growth.
Industry remains a major driver, while electric vehicles, air conditioning and appliances are adding demand in buildings and transport. At the same time, China’s generation mix is changing. In 2025, renewables accounted for 34% of global electricity generation, while coal remained the largest source at 34%. In China, coal’s share of generation fell to 55% in 2025 from 70% a decade earlier, as renewable and nuclear generation expanded.
The challenge is therefore supplying one of the world’s largest electricity systems while reducing its dependence on fossil-fuel generation.
The gap Measured in Consumption
The difference between countries becomes even clearer when electricity use per person is considered. In Sub-Saharan Africa region, 200 kWh is the electricity use per person a year. Advanced economies and China average around 7,000 kWh. That roughly 35-fold difference reflects income, industry, appliance ownership, cooling, transport, infrastructure and the availability of electricity for productive activity.
It also explains why access rates alone are insufficient. The first electricity connection can provide lighting, refrigeration or healthcare. In a high-consuming economy, additional electricity may support electric vehicles, cooling, industrial production or data centres.
Electricity is therefore both an energy issue and a development issue, but the priorities differ sharply across countries.
One Global Target, Different Starting Points
The IEA’s High Electrification Scenario envisages electricity rising from about 23% of global final energy consumption today to 35% by 2035. Reaching that level would require major additions of clean generation, grids, storage and demand flexibility.
But the global picture cannot be reduced to that target. South Sudan is still working towards basic access. Nigeria faces a large access gap alongside questions of reliability and productive use. India is managing rapidly growing demand and a changing generation profile. China is managing one of the world’s largest electricity systems while reducing the role of fossil fuels.
The world is therefore not moving from a common starting line. The electricity gap is measured not only in access rates, but also in 5.4% versus 100% access, 200 versus 7,000 kWh per person, and the very different economic activities that electricity enables. The Age of Electricity may be global. Its starting points are not possibly deepening the inequality.










Sustainability
India Captures 5.7% of Global Greenfield Investment, Outpacing China
India accounted for 5.7% of global greenfield investment between 2020 and 2025, more than double China’s share. UNCTAD data highlight the concentration of investment in AI infrastructure, semiconductors and energy-transition technologies.

Sustainability
The Climate Problem Hiding in Your Kitchen Bin
Food waste sent to landfills can generate methane as it decomposes without oxygen, adding to greenhouse gas emissions and the climate crisis.
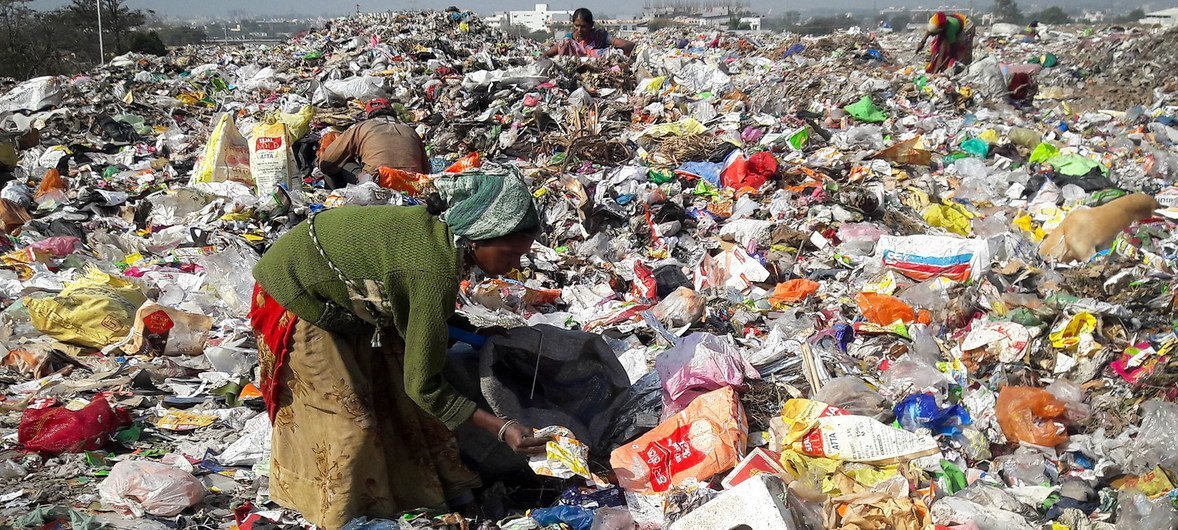
Every day, more than one billion meals go uneaten around the world. What appears to be a problem of excess food, poor planning or household waste is also becoming a climate problem, as discarded food can generate methane when it decomposes in landfills.
Global food waste reached an estimated 1.05 billion tonnes in 2022, accounting for nearly one-fifth of all food available to consumers at the retail, food service and household levels, according to the United Nations Environment Programme (UNEP) Food Waste Index Report 2024.
Households accounted for about 60 per cent of this waste, highlighting how everyday food consumption is closely connected to the global climate challenge.
How wasted food becomes a climate problem
Food waste becomes particularly problematic when it is sent to landfills. Buried beneath layers of other waste, organic matter decomposes in oxygen-poor conditions. Microorganisms then break it down and release methane.
Methane is a far more powerful heat-trapping gas than carbon dioxide over shorter periods. The UN estimates that methane traps about 86 times more heat than carbon dioxide over a 20-year period.
Landfills are therefore an important source of human-caused methane emissions. In the United States, municipal solid waste landfills are the third-largest source of human-related methane emissions.
The scale of food waste also means that the climate impact begins long before food reaches a landfill. Food that is never eaten still requires land, water, energy and other resources to produce, process, transport and store.
The Food and Agriculture Organization (FAO) estimates that around 1.4 billion hectares of agricultural land ,roughly 28 per cent of the world’s agricultural land is used to produce food that is ultimately lost or wasted.
Food waste can also contribute indirectly to deforestation because agricultural expansion remains a major driver of forest loss. Wasting food therefore means wasting the land and natural resources used to produce it.
Cutting waste could deliver faster climate benefits
The climate implications are significant, but methane’s relatively short atmospheric lifetime also presents an opportunity.
Unlike carbon dioxide, which can remain in the atmosphere for centuries, methane breaks down much faster. Cutting methane emissions can therefore produce climate benefits within decades.
“At a time when the world is searching for practical ways to slow warming quickly, tackling food waste may be one of the most immediate and cost-effective climate solutions available,” said Martin Krause, Director of the Climate Change Division at UNEP.
The Food Waste Breakthrough initiative aims to halve food waste by 2030 and could reduce methane emissions by up to 7 per cent.

Food waste represents a major environmental threat .Image credit: Unsplash/Simon Peel
Several countries are already attempting to reduce waste before it reaches landfills. Brazil has introduced national plans focused on reducing food and organic waste, while UNEP is working with authorities, schools, communities and food businesses in Rio de Janeiro to reduce food waste.
In Kenya, a UNEP-supported initiative is recovering surplus food from across the agricultural value chain and redirecting it to early childhood education centres in underserved communities.
What happens to unavoidable food scraps?
Preventing food waste is the most effective way to avoid methane emissions. But food scraps that cannot be prevented can also be managed differently.
When organic waste is separated from other rubbish and composted in oxygen-rich conditions, it does not produce methane in the same way as food buried in an anaerobic landfill environment.
This approach is being promoted in several African countries, where organic material makes up more than half of municipal solid waste. Eleven governments, with support from the UNEP-convened Climate and Clean Air Coalition, have committed to incorporating waste pickers into formal waste-management systems and training them to sort and compost organic waste.
Another emerging approach uses black soldier flies. Their larvae consume organic waste, allowing food scraps to be converted into useful biomass. The approach is already being used in waste-management systems in countries including Uganda and Malawi.
A climate solution hiding in the bin
Global efforts to tackle food waste have gained momentum, but progress remains insufficient. The world is still far from meeting the Sustainable Development Goal of halving per-capita food waste by 2030.
More than 60 countries have also pledged, through the Declaration on Reducing Methane from Organic Waste, to cut waste-sector methane emissions by 30 to 35 per cent below 2020 levels by 2030.
For consumers, the climate connection can begin with something as simple as buying only what is needed, storing food properly and using leftovers.
“Every meal rescued, shared or never wasted is food put to better use. It is also methane avoided,” Krause said.
The message is straightforward: reducing food waste is not only about saving food. It is also about reducing the methane released when that food becomes rubbish and slowing warming in the process.
Earth
Hunter Valley Coal Mine Gets Approval to Run to 2045. What Does It Mean for Australia’s Climate Transition?
Australia’s Hunter Valley coal mine has been approved to operate until 2045, raising questions about how the extension fits into the country’s transition towards lower emissions and its net-zero target.
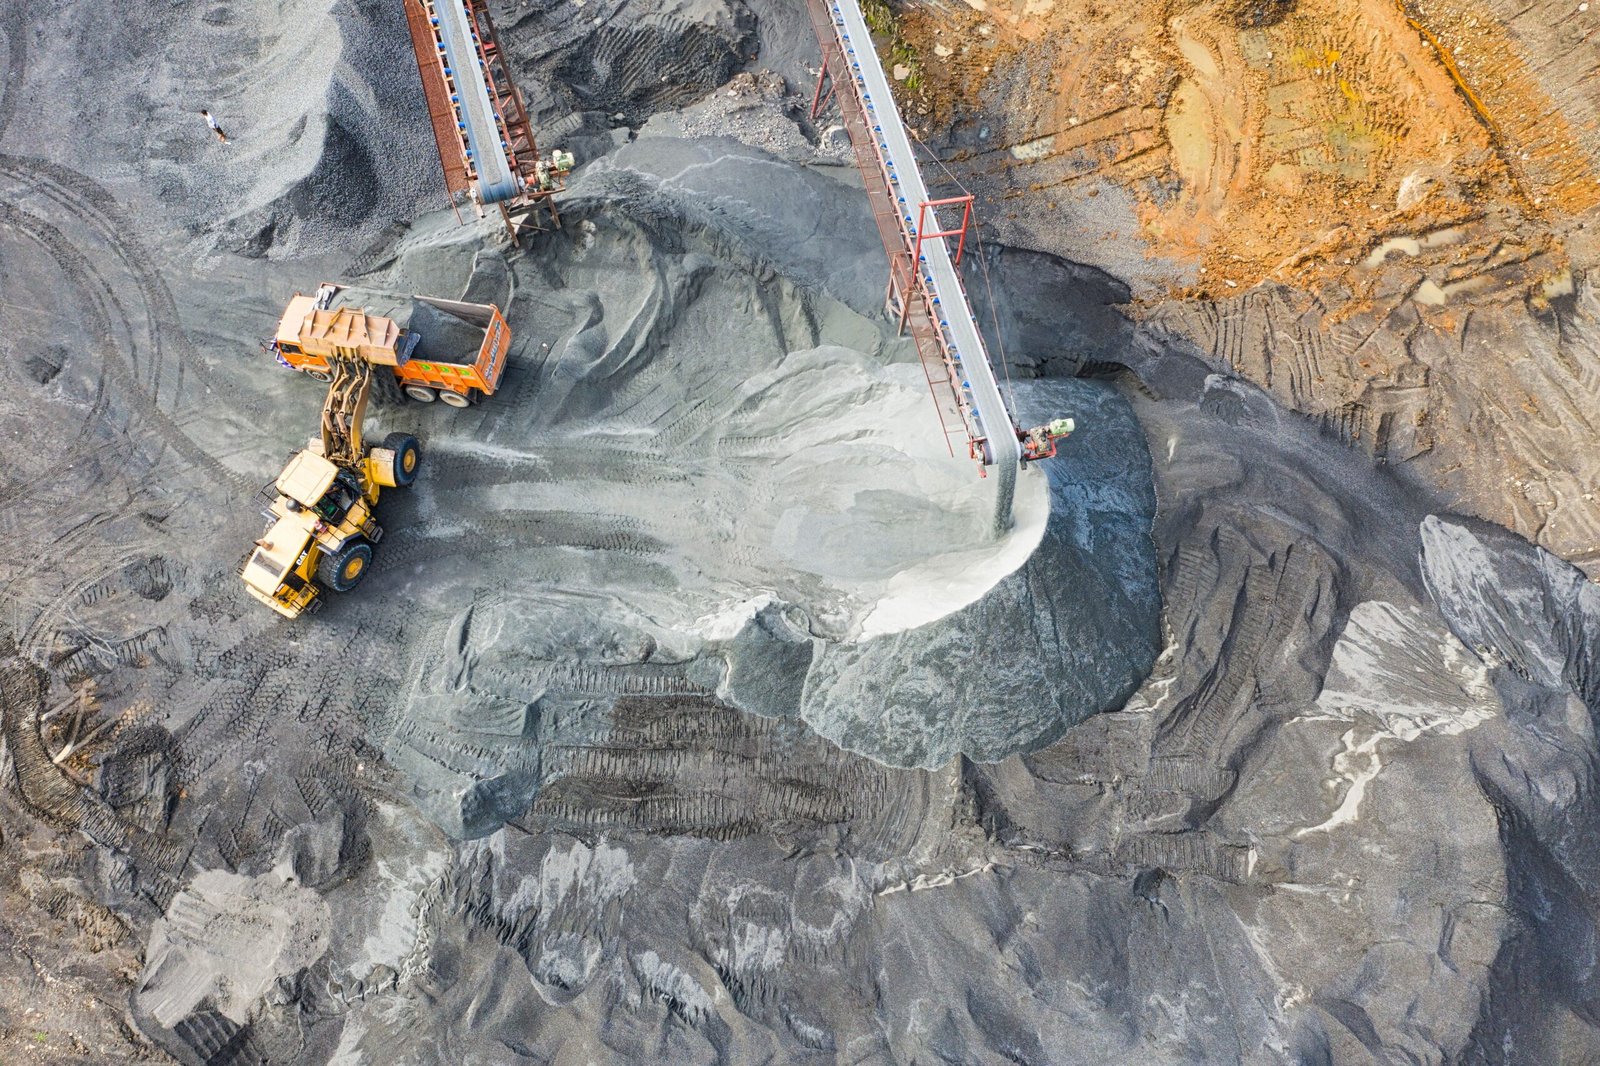
Australia’s transition away from fossil fuels faces a new test after New South Wales approved the continuation of the Hunter Valley Operations (HVO) coal mine until 2045.
The NSW Independent Planning Commission (IPC) on September 30 approved the continuation of HVO North until the end of 2045 and HVO South until the end of 2042. The project would allow an estimated 429 million tonnes of coal to be extracted from the Hunter Valley near Singleton.
The decision is significant not only because of the scale of the mine, but because it extends a major coal operation into the period in which Australia is committed to sharply reducing its greenhouse-gas emissions.
Australia’s current climate commitments include cutting national emissions by 43 per cent from 2005 levels by 2030 and by 62–70 per cent by 2035, with net-zero emissions targeted for 2050.
The latest government inventory estimates Australia’s emissions at 452.4 million tonnes of carbon dioxide equivalent in the year to June 2026, a preliminary 1.8 per cent decline from the previous year. Emissions in the year to March 2026 were 25 per cent below 2005 levels.
Against that backdrop, the IPC acknowledged that the HVO project would have a substantial climate footprint. Its statement of reasons estimates that the project could result in about 809 million tonnes of greenhouse-gas emissions from local mining operations and the eventual combustion of exported coal overseas. The commission said those emissions would contribute to climate impacts in the Hunter, NSW and globally.
The 809-million-tonne figure needs an important qualification to note. it is a lifecycle-related estimate that includes overseas combustion emissions and should not be interpreted as emissions produced directly by the mine.
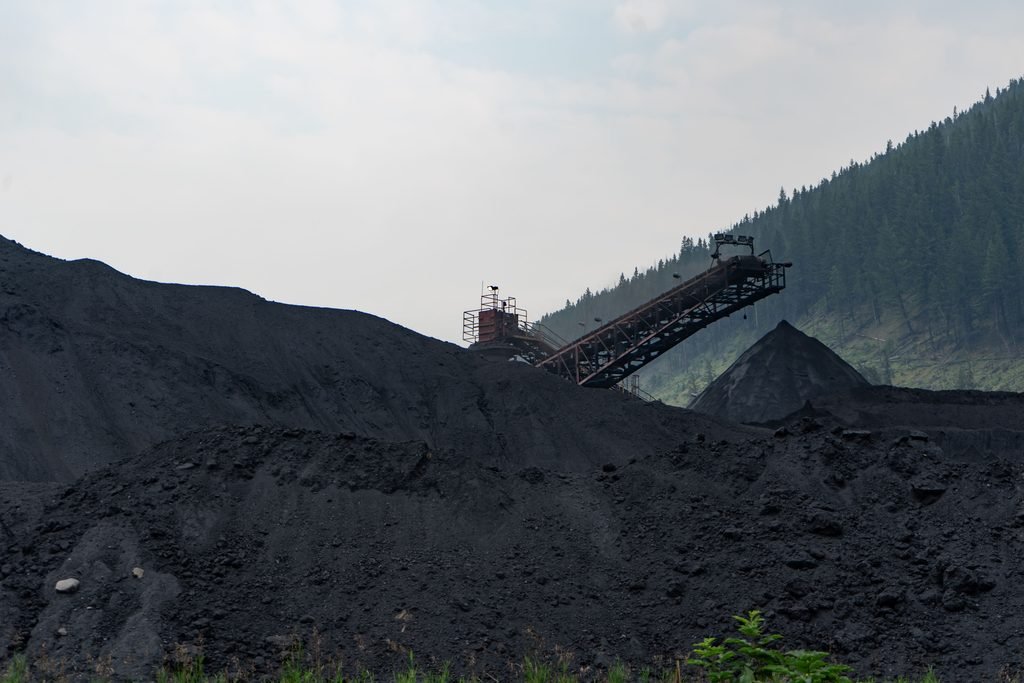
Coal mine.Representational image.Image credit:Pexels
The economic case for the extension is substantial. HVO employs more than 1,500 people and engages more than 800 suppliers, according to evidence presented to the IPC. The NSW Government says the continuation could secure up to 1,500 ongoing jobs and create about 600 temporary positions through infrastructure upgrades, subject to federal approval.
The approval also comes with conditions intended to address the mine’s emissions and its eventual transition. HVO must prepare a Scope 3 Management Plan dealing with emissions associated with exported coal, maximise renewable electricity use at the mine and purchase additional carbon offsets. It must also prepare a comprehensive closure plan within 12 months, in consultation with local councils and communities, outlining how the mine will transition towards closure while supporting workers and the local economy.
The NSW Government argues that the decision can support regional employment while maintaining the state’s broader emissions-reduction pathway. It says the approved proposal has 43 per cent lower Scope 1 emissions than the company’s 2022 application. NSW’s 2026–50 coal policy also allows extensions of existing mines while ruling out applications for new greenfield coal mines.
At the national level, the federal Safeguard Mechanism is intended to reduce emissions from Australia’s largest industrial facilities. The government says the mechanism is designed to put covered facilities on a trajectory consistent with the country’s 2030 target and net-zero goal.
That creates the central question around HVO’s extension. How does Australia manages the economic and employment role of existing coal regions while reducing emissions over the same period.
The NSW approval does not settle that question. The project still requires approval from the Australian Government under the Environment Protection and Biodiversity Conservation Act.
For the Hunter Valley, the decision provides a longer operating horizon for an established coal industry. For Australia’s climate transition, it brings the challenge of managing an economy in which existing fossil-fuel assets continue operating while national policy seeks progressively sustainable energy and lower emissions.


NMC Directs Medical Colleges to Set Up Patient Safety Committees

The Monsoon’s New Rhythm: Less Rain, More Intense Downpours

World Food Day: India’s Childhood Obesity Burden Raises Concerns Over Diabetes Risk

COP17: Can the World Still Meet Its Biodiversity Goals by 2030?

Chandigarh’s Sukhna Wetland Gets Ramsar Recognition, Taking India’s Count to 103

From Scams to Screens: How the National Stock Exchange Rewrote India’s Equity Story

Knowing When to Think for Ourselves: AI, Intuition and the Education of Discernment

After a Scorching Summer, Delhi’s Children Are Slow to Return Outdoors

Two Chemists Win Nobel Prize for Solving a Century-Old Puzzle: Why Life Picks One Hand Over the Other

India’s AI Moment Rests on More Than Code

-

 Math3 months ago
The 2026 Fields Medals: Four Proofs, Four Decades-Old Problems Solved
-
EP Deep Dive: Data & Solutions3 months ago
After Kerala’s Deadliest Landslide, the Hardest Thing to Rebuild Was Childhood
-
EP Deep Dive: Data & Solutions3 months ago
West Asia Crisis: Can Kerala’s Returning Gulf Migrants Find a Future in the Green Economy?
-
Space & Physics5 months ago
India Semiconductor Mission: ‘It’s Not About Fabs. It’s About Building An Entire Ecosystem’
-
Interviews3 weeks ago
From Scams to Screens: How the National Stock Exchange Rewrote India’s Equity Story
-
Climate5 months ago
The Climate World Cup? How Climate Change Could Affect Player Performance at the 2026 World Cup
-
Society3 months ago
What Is Civilisational Diplomacy? Understanding India’s Newest Foreign Policy Tool
-
Society4 months ago
From Bell Labs to the Classroom: A Second Career in Teaching