EduNews & Views
PRASHAST: 72 Lakh Teachers Sensitised to Identify Children Who May Need Disability Support
More than 72 lakh teachers have been sensitised through a nationwide initiative using PRASHAST to promote disability screening, early identification and inclusive education in schools.

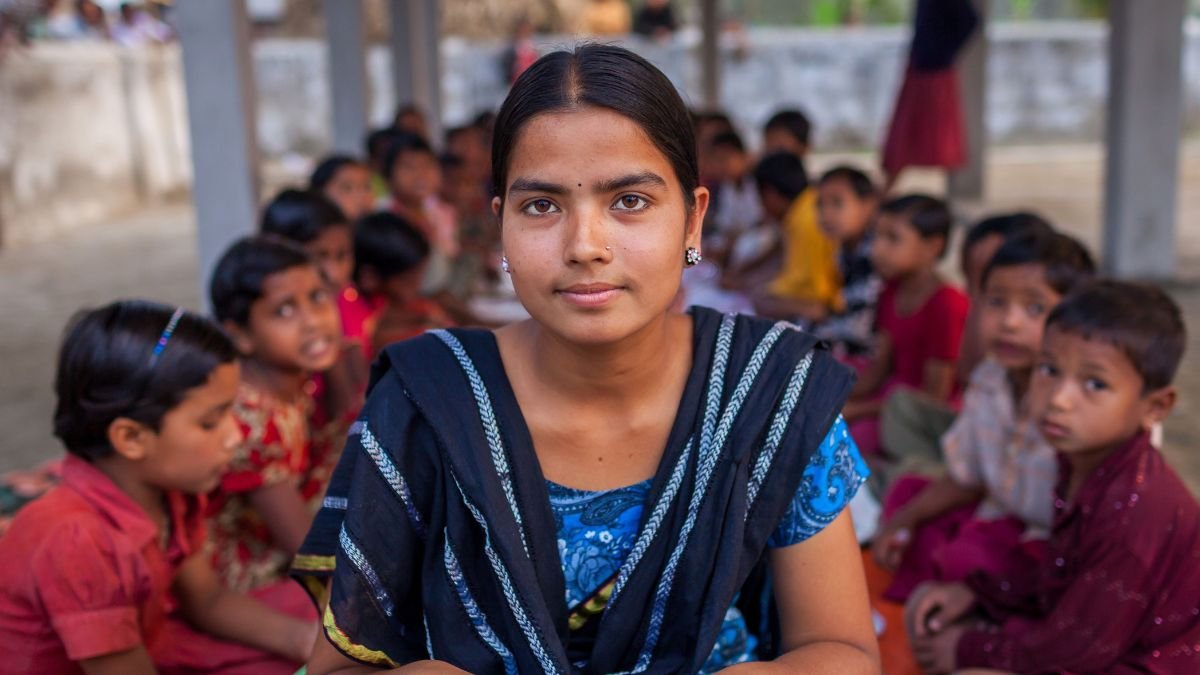
More than 72 lakh teachers have been sensitised to inclusive education through a nationwide initiative involving over 60,000 schools, the Union Ministry of Education announced on October 8. The initiative uses PRASHAST, a digital platform developed to help schools identify children who may have disabilities and require further assessment.
The Department of School Education and Literacy has been conducting the sensitisation drive for three months. The 30-minute orientation module aims to help teachers and other school personnel recognise the needs of children with special needs and create safer, more accessible learning environments.
The announcement concerns the reach of the sensitisation module. It does not establish how many children have been screened or how many have been referred for professional assessment.
Schools Need a Standardised Screening Tool
Children’s disabilities do not always have visible signs. Difficulties with reading, writing, communication, hearing, mobility or social interaction may indicate a need for additional support, but these observations alone cannot establish a disability.
The National Council of Educational Research and Training (NCERT) developed PRASHAST, short for Pre-Assessment Holistic Screening Tool, to give schools a structured way to identify children who may need further evaluation.
The tool covers all 21 disability conditions recognised under the Rights of Persons with Disabilities (RPwD) Act, 2016. These include conditions relating to vision, hearing, speech and language, locomotor disabilities, intellectual disability, specific learning disabilities, autism spectrum disorder and mental illness, among others.
Before the introduction of a uniform checklist, schools lacked a common screening framework covering all 21 conditions. PRASHAST was developed to help teachers use their regular interactions with students to flag possible concerns systematically.
The tool is aligned with the National Education Policy (NEP) 2020, the Right to Education Act, 2009, and the inclusive education objectives of the Samagra Shiksha programme.
How PRASHAST Works
PRASHAST uses a two-part checklist to separate initial classroom observations from the second-stage review. Part 1: Screening by regular teachers. Class and subject teachers use the first checklist to record observable indicators that may suggest a disability. The checklist is designed to use accessible language rather than rely heavily on medical terminology.
The screening is intended to draw on observations made over time and in different situations. The NCERT guidelines specify that children should be observed for a considerable period, with a minimum of 15 days indicated for the second-stage review, across settings such as classrooms, playgrounds and other school activities.
Part 2: Review by special educators. Special educators, counsellors or other designated personnel review the first-stage observations and conduct a second-level screening. This helps validate the initial findings and tentatively identify the disability category that may require further assessment.
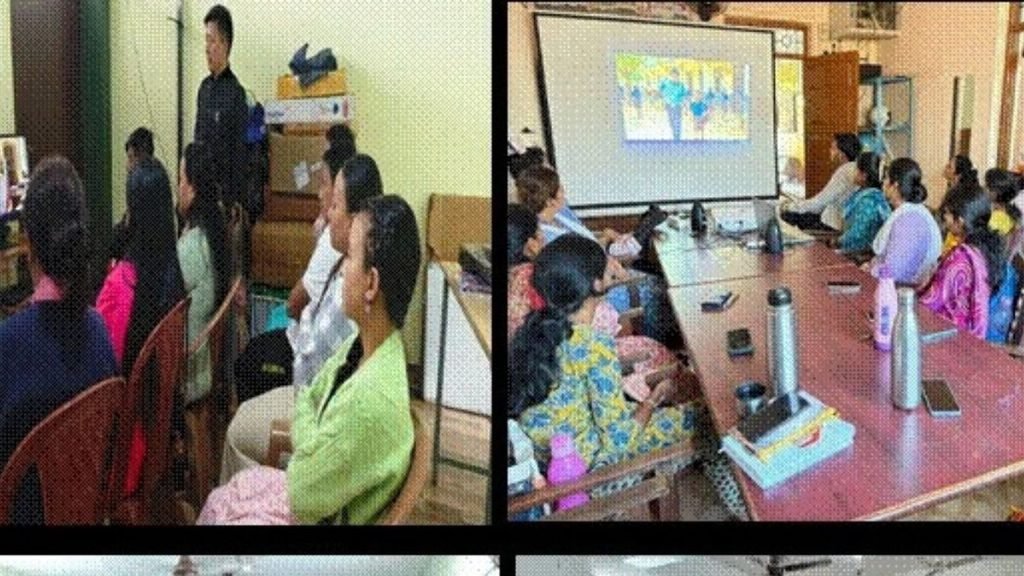
The digital platform can generate school-level reports that can be shared with the relevant authorities to facilitate follow-up, including assessment and disability certification under the applicable procedures. PRASHAST is a preliminary screening tool, not a diagnostic test. A child flagged by the checklist does not automatically have a disability. Formal assessment by qualified professionals is necessary to establish a diagnosis and determine the support required.
What the Sensitisation Module Covers
The latest nationwide drive extends beyond classroom teachers. The Ministry’s 30-minute module is designed for special educators, school heads and non-teaching personnel, including transport drivers, clerical staff, receptionists and wardens.
It uses practical examples and interactive activities to help school personnel understand children’s needs and adopt appropriate, respectful practices. The module is available in 12 Indian languages, according to the Ministry.
This wider participation matters because inclusion depends on more than classroom instruction. A child with a mobility impairment may face barriers in accessing school facilities, while a child with hearing difficulties may need adjustments to classroom communication. Staff responsible for transport, administration and other school services also influence whether children can participate safely and independently.
Sensitisation can help school personnel respond more appropriately to these needs. However, awareness training alone cannot provide the specialist support, accessible infrastructure or individual accommodations that some children require.
What the law requires schools to recognise
The Rights of Persons with Disabilities Act, 2016, provides the legal framework for recognising 21 specified disability conditions and protecting the rights of persons with disabilities. Its provisions include obligations relating to inclusive education and access to educational opportunities.
The National Education Policy 2020 also emphasises equitable access to education, including support for children with disabilities and specific learning disabilities. Early identification can help schools and families seek appropriate educational adjustments, specialist services and formal assessment.
PRASHAST supports this process by giving schools a common starting point. Its role is to flag possible needs and facilitate referrals, rather than replace medical or psychological evaluation.
The test is what happens after identification
The Ministry’s announcement establishes the scale of the sensitisation exercise, but it does not provide figures on the number of children screened through PRASHAST, the number of cases referred for assessment or the number who subsequently received support.
These are important measures of the initiative’s impact. Teacher awareness can help bring previously overlooked needs to attention, but children benefit only when schools can act on those observations.
That requires access to special educators, clear referral procedures, coordination with families and qualified professionals, and appropriate classroom support. Schools also need to handle screening information confidentially and avoid labelling children on the basis of preliminary observations.
The nationwide training drive broadens awareness of inclusive education across India’s schools. Its longer-term value will depend on whether that awareness translates into timely assessments and meaningful support for children who need it.



EduNews & Views
Global Patent Applications Hit Record 3.9 Million in 2025; India Sees 37.5% Growth
Global patent applications reached a record 3.9 million in 2025, with China accounting for more than half the increase. India recorded a 37.5% rise, crossing 100,000 applications for the first time.

Global patent applications crossed 3.9 million in 2025, registering a 6% increase over the previous year and the fastest annual growth since 2016. According to the World Intellectual Property Organization (WIPO), China accounted for more than half of the additional applications. India recorded a 37.5% rise, crossing 100,000 filings for the first time.
Patent applications are formal requests for legal protection of inventions. They allow individuals, companies and research institutions to seek exclusive rights over their innovations, preventing others from commercially using them without permission if a patent is granted. The number of applications therefore offers an indication of innovation and research activity, although not every application results in a granted patent or a marketable technology.
The increase of approximately 224,000 applications worldwide was concentrated largely in four countries: China, Japan, India and South Korea. Together, they accounted for about 94% of the net global increase, according to WIPO’s World Intellectual Property Indicators 2026 report.
China Accounts for More Than Half of Global Patent Application Increase
China contributed 113,693 additional patent applications in 2025, accounting for more than half of the worldwide increase. Inventors and applicants residing in China filed approximately 1.9 million applications globally, retaining the country’s position as the largest source of patent filings.
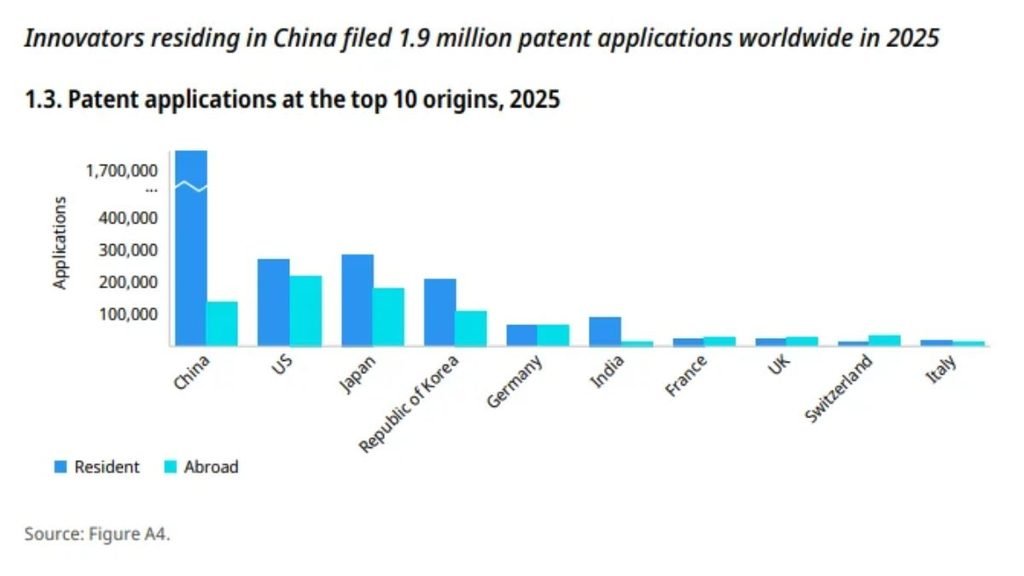
The United States followed with 489,766 applications, while Japan recorded 466,301. These figures include applications filed both within the respective countries and abroad. Japan added 45,310 applications during the year, making it the second-largest contributor to global growth. India followed with an additional 28,690 applications, while South Korea contributed 23,169.
India Crosses 100,000 Patent Applications
India recorded 105,163 patent applications in 2025, marking the first time the country crossed the 100,000 threshold. The 37.5% increase also marked its seventh consecutive year of double-digit growth. The rise was driven primarily by an increase in applications filed by Indian residents, indicating growing domestic participation in patent activity. India was the third-largest contributor to the global increase, after China and Japan.
WIPO’s figures also show that applications received by India’s patent office increased by 27.8% in 2025. This marks the ninth consecutive year of growth at the office and the fourth successive year of double-digit increases. Kerala recorded 827 patent applications in 2024–25, up from 637 in the previous financial year, according to the Indian Patent Office.
However, a separate analysis by the Gulati Institute of Finance and Taxation has pointed to a gap between the state’s research spending and patent generation, raising questions about how effectively research investments are translating into intellectual property. The study also highlighted a gap between government research funding and patent output. Educational institutions received 44.81% of the state’s R&D allocation but accounted for only 7.29% of its patents.
Asia Accounts for 71.2% of Global Patent Filings
Intellectual property offices located in Asia received approximately 2.8 million patent applications in 2025, accounting for 71.2% of the global total. The region’s share has increased from 61.9% in 2015, reflecting a steady shift in global patent activity over the past decade.
China accounted for approximately 68.5% of the applications received across Asian offices. Africa was the other region, besides Asia, to record an average annual growth rate above the global average over the past decade.
Computer Technology Leads Patent Filings
Computer technology remained the largest field of patenting, accounting for 13.6% of global patent filings, according to WIPO’s technology-sector analysis. The field’s share has grown over the past decade, reflecting its expanding role in technological development.
WIPO’s report also tracks patent activity across fields such as digital communication, medical technology and electrical machinery, offering insights into areas attracting research and development activity.
EduNews & Views
Woxsen University Ranks 12th Globally in MBA Entrepreneurship Ranking, Fourth in Startup Launches
Woxsen University has secured 12th place in the 2027 Poets&Quants MBA entrepreneurship ranking, with 15% of its MBA graduates from the 2021–2025 cohorts reportedly launching ventures within three months of graduation.
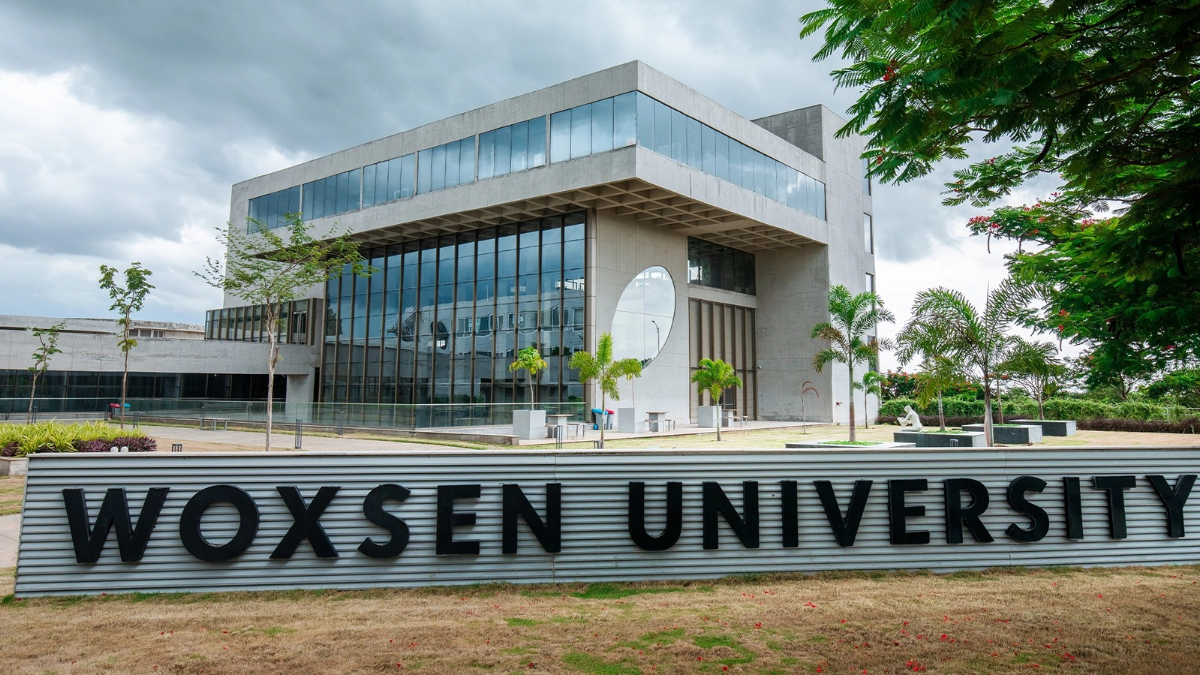
Woxsen University in Hyderabad has been ranked 12th globally in the 2027 Best MBA Programs for Entrepreneurship ranking released by Poets&Quants, with the institution placing fourth worldwide in the category measuring startup launches by MBA graduates.
According to the university’s press release, an average of 15% of its MBA graduates from the Classes of 2021–2025 launched ventures within three months of completing their degrees. The figure contributed to the institution’s performance in a ranking that places considerable emphasis on entrepreneurial outcomes rather than relying solely on academic reputation or programme structure.
Woxsen’s overall position puts it ahead of several established business schools, including Arizona State University’s W. P. Carey School of Business, Brigham Young University’s Marriott School of Business, London Business School and Carnegie Mellon University’s Tepper School of Business.
The 2027 ranking assigns 25% weightage to the proportion of MBA graduates pursuing entrepreneurial ownership within three months of graduation. It also recognises business acquisitions as a form of entrepreneurship, broadening the scope beyond graduates establishing new ventures.

Students attend a classroom session at a business school.Image credit:Woxsen university
The university’s fourth-place position in the startup-launch category indicates the reported proportion of graduates moving into venture creation. However, the 15% figure represents an average across five graduating cohorts and does not, by itself, establish the long-term survival, revenue generation or employment impact of these ventures.
Woxsen first entered the Poets&Quants entrepreneurship ranking in 2026, when it featured among the global top 12 and was identified by the university as the only Asian business school in that group. Its position in the 2027 edition marks a continuation of that presence.
The ranking draws attention to a broader question facing MBA programmes: how effectively do business schools translate entrepreneurship education into actual venture creation? While business schools increasingly incorporate startup development, business planning and experiential learning into their curricula, graduate venture formation offers one measurable indicator of their outcomes.
Woxsen’s latest ranking provides one such indicator, although further information on the ventures launched, their subsequent performance and the methodology used to verify startup activity would offer a more comprehensive picture of the programme’s entrepreneurial impact.
EduNews & Views
Indian universities lead Asia in research output per faculty, but the country’s top six all slip in QS ranking
Five Indian institutions are in the regional top 10 for papers per faculty member. IIT Delhi, still India’s highest-ranked university, falls from 59th to 66th.

What Declining Freshwater Storage Means For India?

Pune to Host India International Science Festival 2026, With Focus on Students, Startups and Public Engagement

What Can Himalayan Marmot Droppings Tell Us About Climate Change?

$71 Billion Carbon Market, but Only $1.6 Billion in Government Deals: COP31 Exposes Gap Between Carbon Credit Supply and Demand

India’s Richest Agree on One Cause Above All Others: Education

Indian universities lead Asia in research output per faculty, but the country’s top six all slip in QS ranking

Why Delhi’s Geography Makes It Vulnerable to Severe Air Pollution
India’s Richest Agree on One Cause Above All Others: Education

Europe Braces for Extremes as Commission Unveils Climate Resilience Framework

NASA recruits new astronauts for future Moon Base and Mars missions
-

 Math4 months ago
The 2026 Fields Medals: Four Proofs, Four Decades-Old Problems Solved
-
EP Deep Dive: Data & Solutions4 months ago
After Kerala’s Deadliest Landslide, the Hardest Thing to Rebuild Was Childhood
-
EP Deep Dive: Data & Solutions5 months ago
West Asia Crisis: Can Kerala’s Returning Gulf Migrants Find a Future in the Green Economy?
-
Space & Physics6 months ago
India Semiconductor Mission: ‘It’s Not About Fabs. It’s About Building An Entire Ecosystem’
-
Interviews2 months ago
From Scams to Screens: How the National Stock Exchange Rewrote India’s Equity Story
-
Climate & Environment6 months ago
The Climate World Cup? How Climate Change Could Affect Player Performance at the 2026 World Cup
-
Society4 months ago
What Is Civilisational Diplomacy? Understanding India’s Newest Foreign Policy Tool
-
Society5 months ago
From Bell Labs to the Classroom: A Second Career in Teaching