
Earth
Equal Earth: The Map That Shows the World at Its Actual Size
The world map most of us know does not accurately show the relative size of countries and continents. The Equal Earth projection offers a different way of representing the planet, preserving the relative area of landmasses and revealing just how much conventional maps distort our view of the world.


For most people, the world map is something so familiar that it rarely gets questioned. Africa sits roughly in the middle. Europe is above it. India is to the east. Greenland appears surprisingly large. Russia stretches across an enormous section of the northern hemisphere. But take the same countries and continents and put them on a globe, or on a map designed to preserve area, and the picture changes. This is the idea behind Equal Earth, a map projection designed to represent countries and continents according to their relative land area.
Greenland shrinks. Africa becomes much larger. Europe occupies far less space than many classroom maps suggest. The northern parts of the world lose some of the visual dominance they acquire on conventional maps.
The projection has gained new attention after the United Nations General Assembly backed a resolution encouraging the use of equal-area world maps. The resolution, led by Togo and supported by 164 countries, promotes Equal Earth as a more representative way of showing the size of the world’s landmasses. The important part of the story, however, is not that a new map has suddenly appeared. Equal Earth was created eight years ago. What has changed is the attention being given to the idea behind it.
Map: Round Earth Without Making Compromises
The Earth is roughly spherical. A conventional map is flat. That creates a problem that cartographers have dealt with for centuries: flattening a globe inevitably changes something. A map can preserve area, but distort shape. It can preserve direction, but distort size. It can attempt to balance several forms of distortion, but cannot eliminate all of them.
The famous Mercator projection is a good example. Developed by Gerardus Mercator in 1569, it was designed primarily for navigation. Its great advantage was that it preserved angles and made it easier for sailors to plot courses using compass bearings. It was not designed to show the relative size of countries. Yet the projection became one of the most familiar representations of the world.
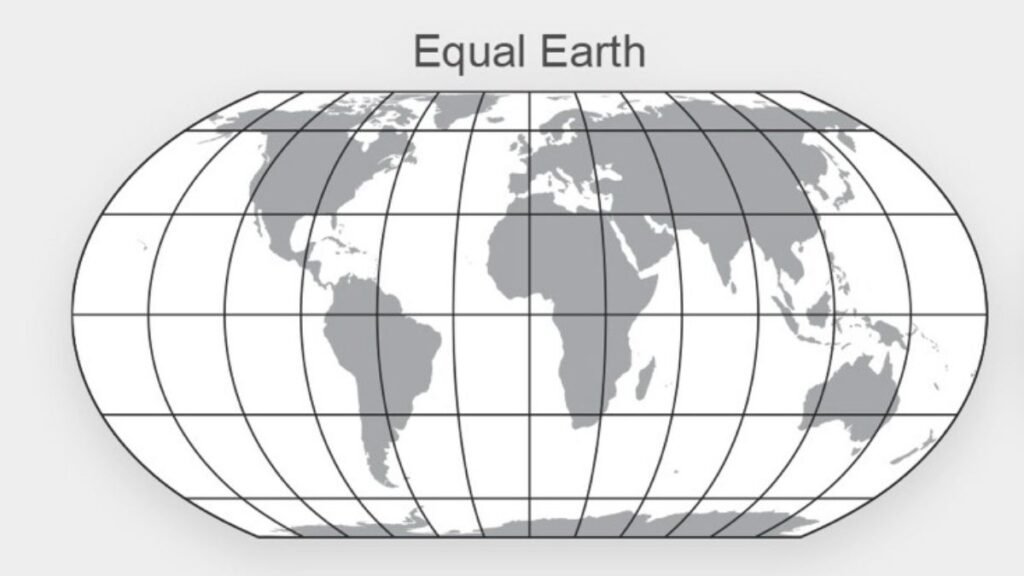
That creates some striking visual differences. On a Mercator map, areas become increasingly enlarged towards the poles. Greenland therefore appears vastly larger than it really is relative to Africa. In reality, Africa covers about 30.4 million square kilometres, while Greenland covers about 2.2 million square kilometres. Africa is roughly 14 times larger.
A map cannot change that geographical fact. But the projection used to draw it can make the difference difficult to see.
Equal Earth Starts With a Different Question
Instead of asking how to preserve direction, Equal Earth asks a different question: What if the area occupied by a country on the map should correspond to its actual area on Earth? That is what makes it an equal-area projection.
Equal Earth was introduced in 2018 by cartographers Bojan Šavrič, Tom Patterson and Bernhard Jenny. Their objective was to create an equal-area world map that was also visually balanced and suitable for general use. The projection was inspired partly by the Robinson projection, but unlike Robinson, it preserves the relative size of areas. The result looks familiar enough to be recognisable as a world map, but the proportions are different. Africa gets the space its area deserves.
South America appears considerably larger relative to Europe. India and other countries at lower latitudes no longer look as small compared with countries farther north. Greenland is no longer visually comparable with Africa. It stops making Africa look smaller.
What Does “Equal Area” Actually Mean?
It does not mean every country is made the same size.
“Equal” in Equal Earth refers to the preservation of area, not equality between countries. If Country A has twice the land area of Country B, an equal-area projection will preserve that relationship on the map. This becomes particularly useful when maps are being used to compare geographical phenomena.
An equal-area projection prevents the map itself from exaggerating some regions simply because of where they are located on the globe.
Why Does Africa Look So Different?
Africa is at the centre of much of the current discussion because the continent is particularly affected by the distortion of the Mercator projection. Most of Africa lies closer to the equator than Europe, North America and Russia. The farther north or south one moves from the equator, the greater the enlargement becomes on a Mercator map.
As a result, northern countries and territories occupy disproportionately large areas on the map, while Africa appears comparatively compressed.
Mercator’s projection was created for navigation in the 16th century. Its distortions are a consequence of the mathematical properties that make it useful for that purpose. But once a particular map becomes the dominant image of the world, its visual effects can influence how people understand geographical scale. That is one reason the Equal Earth debate has moved beyond cartography.
Map Can Influence How We Imagine the Planet
A student looking at a world map may not know the actual area of Africa, Greenland or South America. The map becomes the reference point. If Greenland looks almost as large as Africa, the brain absorbs that relationship before a textbook provides the numbers. This is why the choice of projection matters in education.
An equal-area map does not necessarily provide a more useful map for every lesson. But when the lesson is about how much land exists where, preserving area becomes important. The same principle applies to news graphics.
A map showing global temperatures, deforestation or agricultural production can communicate a very different impression depending on the projection used. The projection is therefore part of the information being presented, even when the audience never notices it.
Not a Perfect Picture of Earth either
There is an important misconception to avoid. Equal Earth does not eliminate distortion. No flat map can. Because the Earth is curved, every projection has to compromise somewhere. Equal Earth preserves area, but shapes and distances are not perfectly preserved. That is why cartographers use different projections for different purposes. A navigation chart may benefit from Mercator.
A map comparing the size of continents may benefit from Equal Earth. A map intended to show a general visual impression of the world may use another projection altogether. There is no single map that is mathematically perfect for every purpose.
Why the UN’s Decision Matters
The UN resolution does not legally abolish the Mercator projection. It encourages countries, educational institutions and organisations to consider equal-area alternatives, particularly Equal Earth. The resolution is therefore better understood as a recommendation about representation rather than a global cartographic mandate.
The vote also reflects a broader argument about how geographical knowledge is presented.
Togo and other African countries have argued that the familiar world map does not adequately communicate the actual scale of Africa. The campaign has therefore connected cartographic accuracy with representation and the legacy of how the world has historically been depicted.
The debate is not really about whether Africa should be made to look bigger. It is about whether a map used to teach and communicate geography should give viewers a reasonably accurate impression of the relative size of the world’s landmasses. The next time you see a world map, it is worth asking one question before reading it: What does this map preserve?







Climate & Environment
Global Ecosystem Restoration Progress Falls Short of 2030 Targets, UN Report Warns

Ecosystem restoration efforts are expanding across the world, but progress remains insufficient to meet global biodiversity targets for 2030, according to a new report released by the Food and Agriculture Organization of the United Nations (FAO), the United Nations Environment Programme (UNEP) and the Secretariat of the Convention on Biological Diversity (SCBD).
The report, Restoration Progress Report: Nature’s Comeback – Scaling Ecosystem Restoration for People and Planet, documents approximately 252 million hectares of terrestrial, freshwater, marine and coastal ecosystems under restoration across 149 countries in 2026. Despite this progress, the report warns that implementation must triple to achieve the global commitment to restore 30 per cent of degraded ecosystems by 2030.
Countries have collectively committed to restoring approximately one billion hectares through national plans, international agreements and regional initiatives. However, the documented restoration area represents only about a quarter of these commitments, highlighting the gap between political ambition and action on the ground.
The assessment comes as the United Nations Decade on Ecosystem Restoration (2021–2030) enters its second half. It examines restoration progress across different ecosystems, the financial resources required and the measures needed to accelerate recovery.
The report identifies land-use change, agricultural expansion, deforestation, overexploitation of natural resources, pollution and climate change as major drivers of ecosystem degradation. These pressures frequently interact, making recovery more difficult and expensive.
More than 1.56 billion hectares of land, representing over 15 per cent of the global land surface, are estimated to be degraded. Between 2015 and 2019, at least 100 million hectares of previously healthy and productive land were degraded annually. Agricultural lands account for more than 60 per cent of global land degradation, with an estimated 480 million hectares of cropland and 560 million hectares of pastureland affected.
Freshwater and marine ecosystems lag behind
Restoration progress varies considerably across ecosystem types. Terrestrial ecosystems account for the largest share of documented restoration, with approximately 232 million hectares under restoration. However, this still represents only about half of the 469 million hectares estimated to be required to meet the 2030 restoration target for terrestrial ecosystems.
Freshwater ecosystems face a substantially larger implementation gap. Only around 11 million hectares are documented as being under restoration, representing approximately 4.5 per cent of the estimated 244 million hectares required to meet the target.
Marine and coastal ecosystems have approximately 5.7 million hectares under restoration, equivalent to around 23 per cent of their estimated 25 million-hectare target.
The report notes that freshwater and marine ecosystems are among the most rapidly degrading environments, despite their importance in supporting biodiversity, food security and livelihoods. Incomplete monitoring and inconsistent national reporting also make it difficult to establish the full extent of restoration activities in these ecosystems.
Funding gap threatens restoration ambitions
Financing remains another major obstacle. Global restoration investments reached approximately $64 billion in 2022, but annual funding needs to increase to $296 billion by 2030 and $448 billion by 2050 to meet restoration requirements.
The report calls for greater public investment alongside private and blended financing mechanisms. It also stresses the need to redirect financial flows and subsidies that encourage unsustainable resource use and contribute to environmental degradation.
Beyond ecological benefits, restoration could generate significant employment opportunities. The report estimates that more than one million green jobs have been created through the World Restoration Flagships, while ecosystem restoration has the potential to generate over 32 million additional jobs globally by 2030.

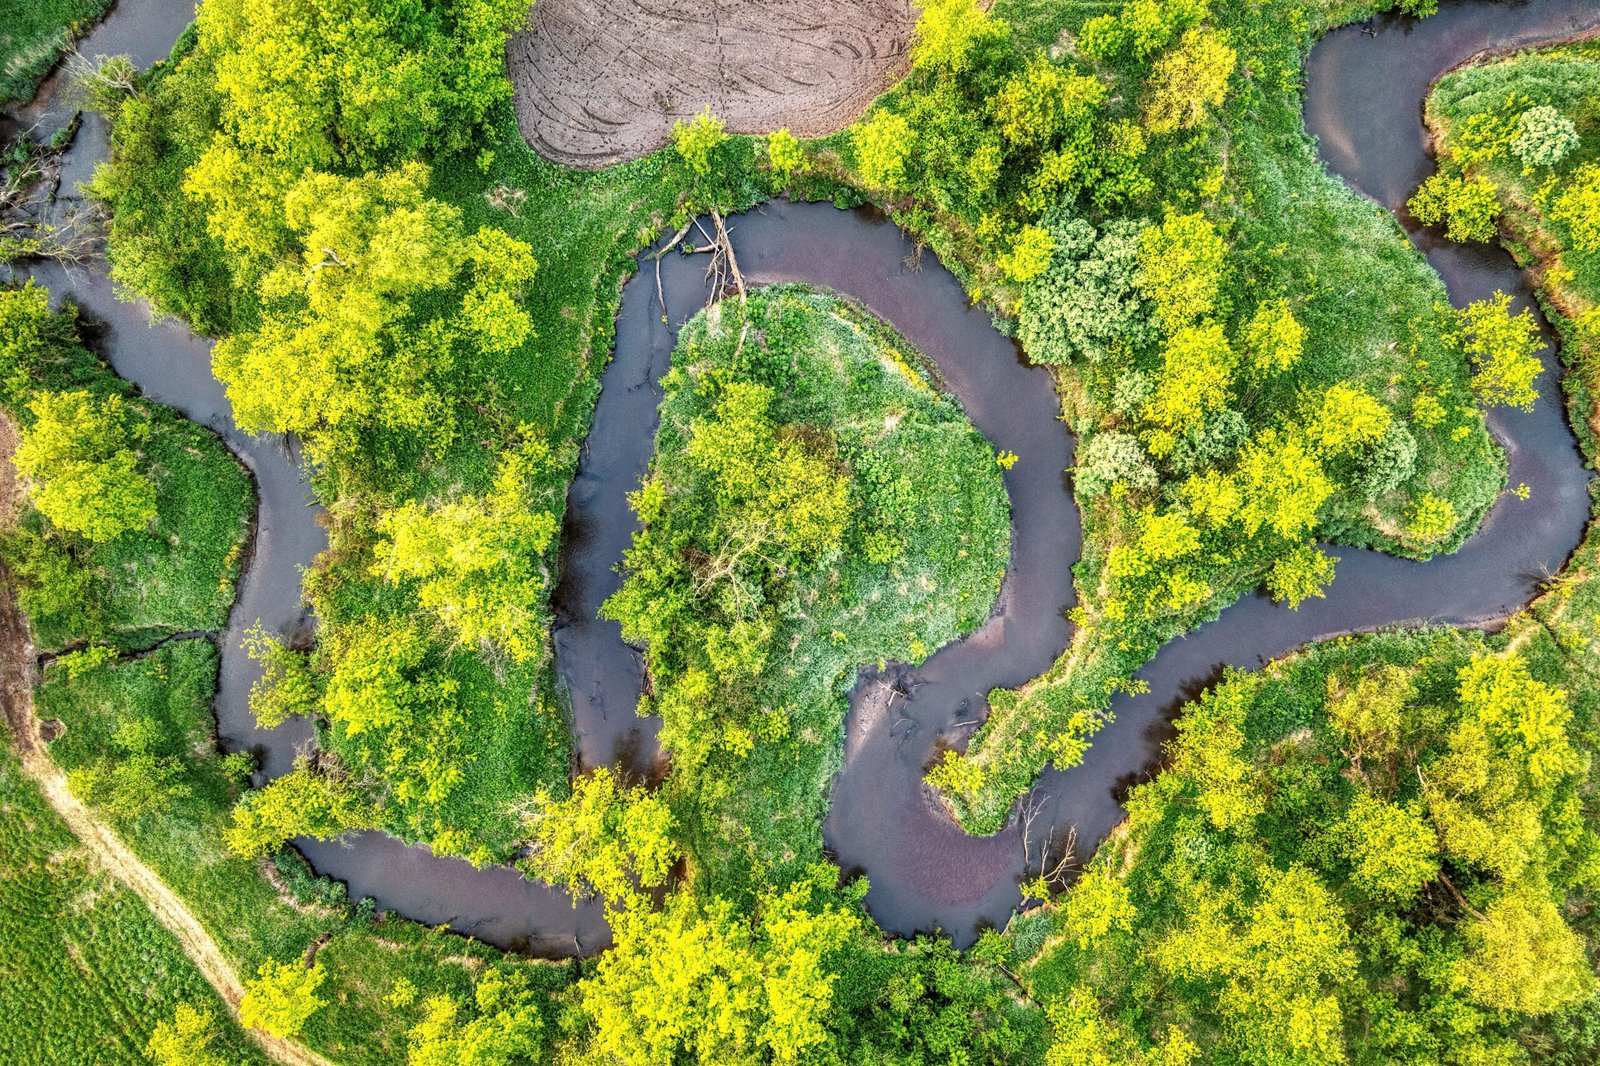
Vibrant green moss and plants beside a gently flowing stream in a natural setting.Image credit:Pexels
It also highlights the potential of restoration to address climate change and biodiversity loss. Research cited in the assessment indicates that restoring just 15 per cent of global priority areas could capture and store carbon equivalent to 30 per cent of the total increase in atmospheric carbon dioxide since the Industrial Revolution, while helping avoid 60 per cent of species extinctions.
The report emphasises that successful restoration requires more than increasing the area of land brought under recovery. It calls for greater participation of Indigenous Peoples and local communities, recognition of land rights, stronger monitoring systems and restoration strategies that address entire landscapes and ecosystems.
As the 2030 deadline approaches, the assessment identifies three priorities for accelerating progress: building a broader global movement for restoration, strengthening political commitment and developing the technical capacity needed to implement and monitor restoration programmes.
It concludes that restoration targets must translate into sustained ecological recovery rather than remain numerical commitments. Preventing further degradation and ensuring that restored ecosystems continue to recover will be essential to securing long-term benefits for biodiversity, climate resilience and human well-being.
Earth
Greener Forests, Weaker Carbon Sinks? Study Finds Declining Productivity in Northeast India
A 24-year satellite-based study finds that Northeast India’s forests are experiencing declining carbon productivity despite relatively stable canopy cover, highlighting how rising atmospheric dryness could weaken their capacity to absorb and retain carbon.
Forests in Northeast India are showing signs of a weakening capacity to accumulate carbon despite maintaining relatively stable canopy cover, according to a study published in Ecological Indicators in October 2026. The research suggests that increasing vegetation greenness does not necessarily indicate stronger carbon sinks, highlighting the need to assess forest health beyond satellite measurements of green cover.
Titled Are Greener Forests Stronger Carbon Sinks? Rising Vapour Pressure Deficit Instigates Greening-Productivity Decoupling in a Tropical Biodiversity Hotspot in India, the study examined forest carbon dynamics across Northeast India using 24 years of satellite-derived data from 2001 to 2024.
Researchers analysed three indicators: Leaf Area Index (LAI), Gross Primary Productivity (GPP) and Net Primary Productivity (NPP). These measurements helped assess changes in forest canopy structure, photosynthetic activity and the amount of carbon retained in plant biomass after accounting for plant respiration.
The analysis found that while canopy structure remained relatively stable and gross primary productivity increased modestly by 1.76 grams of carbon per square metre annually, net primary productivity declined by 0.83 grams of carbon per square metre annually across much of the region.
The researchers identified a divergence between canopy greenness and carbon productivity across approximately 40% of forested areas. A separate divergence between photosynthetic activity and net productivity was observed across around 30% of the region.
These findings indicate that forests can maintain their green appearance without achieving corresponding gains in carbon accumulation.
Atmospheric dryness emerges as a major factor
The study identified rising Vapour Pressure Deficit (VPD) as a primary driver of declining forest productivity. VPD measures the difference between the amount of moisture the atmosphere can hold and the moisture it actually contains. Higher VPD indicates greater atmospheric demand for water, increasing stress on vegetation.
Under such conditions, plants may close their stomata, the small pores on their leaves, to reduce water loss. This also restricts the intake of carbon dioxide required for photosynthesis, potentially reducing the amount of carbon absorbed by vegetation.
The researchers also identified a major shift in forest carbon functioning beginning around 2012. Their analysis suggests that the relationship between canopy structure, photosynthesis and net carbon accumulation has weakened over time.
The findings are particularly significant for Northeast India, which the study identifies as a climatically sensitive biodiversity hotspot containing approximately one-third of India’s forest carbon.
Earlier research points to similar concerns
The findings build on earlier research published in Scientific Reports in December 2023, which examined vegetation productivity across India between 2001 and 2019.
That study found that India’s Leaf Area Index increased by 6.75% in consistently forested areas, while Net Primary Productivity declined by 6.19%. Northeast India, the Western Ghats and parts of Peninsular India emerged as important regions experiencing declining productivity.
The 2023 research associated these changes with rising temperatures, which can reduce photosynthesis and increase plant respiration beyond certain temperature thresholds.
Another study examining a semi-deciduous forest in Kaziranga, published in Agricultural and Forest Meteorology in 2022, demonstrated how carbon exchange varies with seasonal and climatic conditions. It found that the forest functioned as a carbon sink during the pre-monsoon season but as a carbon source during winter in the observed study period.
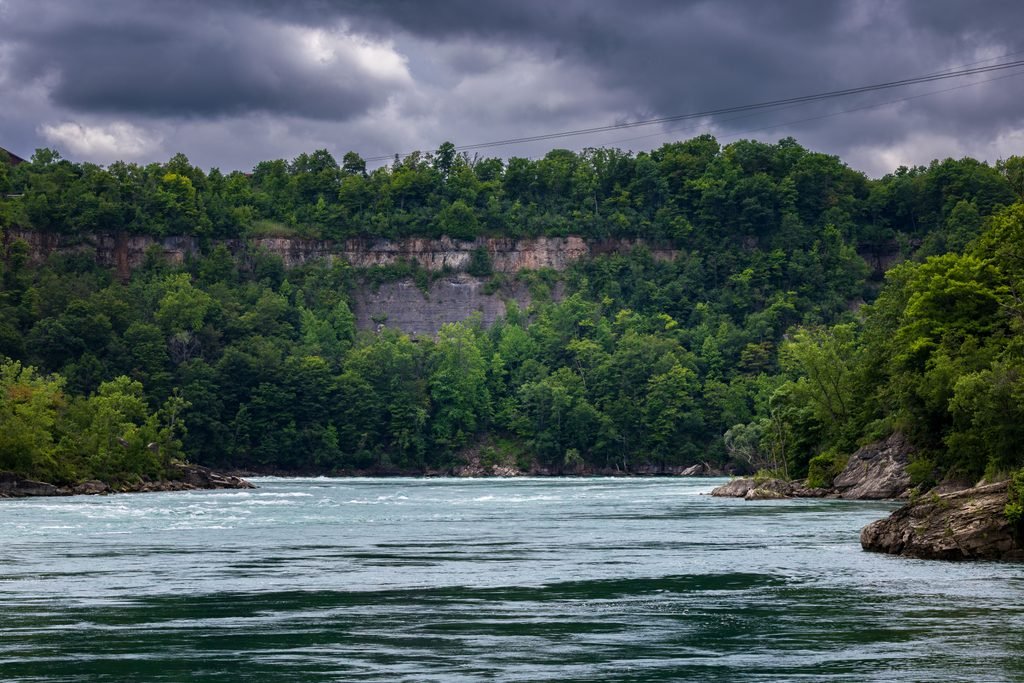
Image of a dense forest alongside a flowing river.Image credit:Pexels
Together, these studies highlight the importance of examining forest productivity, atmospheric conditions and seasonal carbon exchange rather than relying solely on changes in green cover.
The latest research does not suggest that Northeast India’s forests are structurally collapsing. Instead, it points to a less visible change in their ecological functioning, with implications for forest carbon accounting and climate-resilient forest management.
The findings underline the need for monitoring systems that combine satellite observations with measurements of atmospheric stress and carbon productivity to better understand how tropical forests respond to a warming climate.
Earth
252 Million Hectares Under Restoration Across 149 Countries, but UN Warns of 2030 Target Gap
A UN report finds that 252 million hectares across 149 countries are under ecosystem restoration. However, increased investment and accelerated action are needed to meet global restoration targets by 2030.
Global efforts to restore degraded ecosystems have reached 252 million hectares across 149 countries, generating more than one million green jobs. However, a new United Nations assessment warns that restoration efforts remain insufficient to meet international biodiversity targets by 2030, calling for a more than fourfold increase in annual investment.
The findings are presented in the Restoration Progress Report: Nature’s Comeback – Scaling Ecosystem Restoration for People and Planet, released on October 29, 2026, by the United Nations Environment Programme (UNEP), the Food and Agriculture Organization (FAO) and the Secretariat of the Convention on Biological Diversity (CBD).
The report provides the first comprehensive global assessment of progress towards commitments to restore approximately one billion hectares of degraded ecosystems. These commitments are linked to the UN Decade on Ecosystem Restoration (2021–2030) and the Kunming-Montreal Global Biodiversity Framework, which calls for at least 30 per cent of degraded terrestrial, freshwater, marine and coastal ecosystems to be under effective restoration by 2030.
According to the assessment, the 252 million hectares currently documented under restoration represent the largest recorded global restoration effort. However, this accounts for only 34 per cent of the indicative global benchmark associated with the 2030 target.
Freshwater and marine ecosystems lag behind
The report identifies considerable differences in restoration progress across regions and ecosystem types. Asia accounts for the largest share of documented restoration, with 192.2 million hectares, followed by Africa with 36.3 million hectares and Europe with 9.1 million hectares. North and Central America account for 5.8 million hectares, South America 5.4 million hectares and Oceania 3.2 million hectares.
However, the report cautions that these figures should not be interpreted as a ranking of restoration performance, as they also reflect differences in regional land area and monitoring and reporting capacities.
Restoration of terrestrial ecosystems has reached nearly half of the global 2030 target. China reports the largest terrestrial restoration area, with 127.4 million hectares, while substantial restoration activities have also been documented in Mongolia and Kazakhstan.
Progress remains considerably slower in freshwater, marine and coastal ecosystems, despite these environments experiencing rapid degradation.
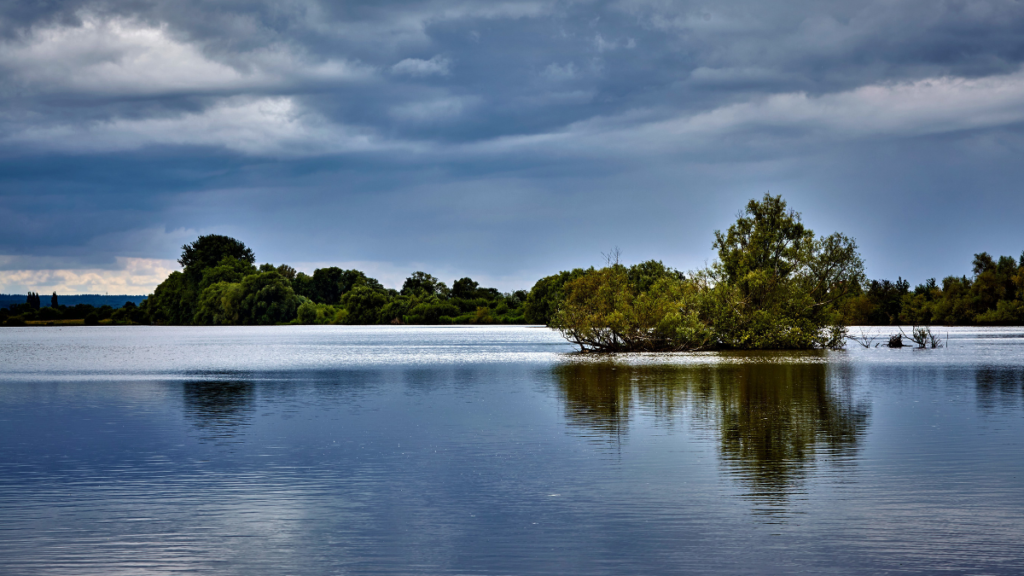
A river along the side of a dense forest. Image credit: Pexels
The assessment documents 11 million hectares of freshwater ecosystems under restoration across 62 countries and 5.7 million hectares of marine and coastal ecosystems across 46 countries. The report also notes that limited monitoring and reporting may mean that actual restoration activities in these ecosystems are higher than the documented figures.
Meanwhile, the share of countries reporting implemented wetland restoration or rehabilitation programmes has increased from 8 per cent in 2022 to 54 per cent.
Restoration financing needs to increase fourfold
Insufficient investment remains a major obstacle to achieving global restoration commitments. The report estimates that annual restoration financing must increase from US$64 billion to US$296 billion by 2030, representing more than a fourfold rise.
Agroforestry requires the largest estimated annual investment, at US$87 billion, followed by restorative reforestation at US$52 billion, peatland restoration at US$44 billion and seagrass restoration at US$28 billion.
The report identifies employment generation as another potential benefit of scaling up restoration. While more than one million green jobs have already been associated with restoration initiatives, increased global investment could generate up to 32 million additional jobs by 2030.
It also highlights the potential contribution of ecosystem restoration to climate mitigation and biodiversity protection. Research cited in the assessment indicates that restoring just 15 per cent of global priority areas could capture and store 30 per cent of carbon dioxide-equivalent emissions released since the Industrial Revolution and help prevent 60 per cent of projected species extinctions.
The report further identifies the participation and leadership of Indigenous Peoples and local communities as essential to ensuring long-term restoration outcomes. Secure land rights, stronger monitoring systems and sustained political commitment are among the priorities identified.
With five years remaining in the UN Decade on Ecosystem Restoration, the assessment calls on governments to move beyond isolated restoration projects towards coordinated, long-term programmes that address the underlying causes of ecosystem degradation.
It emphasises that the 2030 targets should serve as a milestone in the restoration process rather than its conclusion, as ecological recovery requires sustained action and investment beyond the end of the decade.

Between Lectures and Lyrics: Kabeer Is Building a Malayalam Hip-Hop Career One Self-Taught Skill at a Time

Can Studying Cancer Tumours in Space Help Improve Chemotherapy on Earth?

Why Delhi’s Geography Makes It Vulnerable to Severe Air Pollution

Is India paying more than it thinks for chemical farming?

Extreme weather affects India on 92% of days in 2026, raises concerns over climate preparedness

Indian universities lead Asia in research output per faculty, but the country’s top six all slip in QS ranking

After a Scorching Summer, Delhi’s Children Are Slow to Return Outdoors

Europe Braces for Extremes as Commission Unveils Climate Resilience Framework

Automated Homoeopathic Dispensing System Receives Indian Patent

Delhi’s Air Quality Paradox: Lower Average, Higher Everyday Pollution
-

 Math4 months ago
The 2026 Fields Medals: Four Proofs, Four Decades-Old Problems Solved
-
EP Deep Dive: Data & Solutions3 months ago
After Kerala’s Deadliest Landslide, the Hardest Thing to Rebuild Was Childhood
-
EP Deep Dive: Data & Solutions4 months ago
West Asia Crisis: Can Kerala’s Returning Gulf Migrants Find a Future in the Green Economy?
-
Space & Physics6 months ago
India Semiconductor Mission: ‘It’s Not About Fabs. It’s About Building An Entire Ecosystem’
-
Interviews2 months ago
From Scams to Screens: How the National Stock Exchange Rewrote India’s Equity Story
-
Climate & Environment5 months ago
The Climate World Cup? How Climate Change Could Affect Player Performance at the 2026 World Cup
-
Society4 months ago
What Is Civilisational Diplomacy? Understanding India’s Newest Foreign Policy Tool
-
Society5 months ago
From Bell Labs to the Classroom: A Second Career in Teaching