
Climate
When the Himalayas Collapse Without Warning, What Counts as Preparedness?
Nepal flash floods show why Himalayan disaster preparedness must go beyond early warnings to safer infrastructure, land-use planning and climate adaptation.




Climate
Heatwaves are Affecting Fertility Traits in Bees.
A new study finds that heatwave exposure during early development can impair fertility-related traits in solitary bees, raising concerns about the potential effects of extreme heat on pollinator populations.

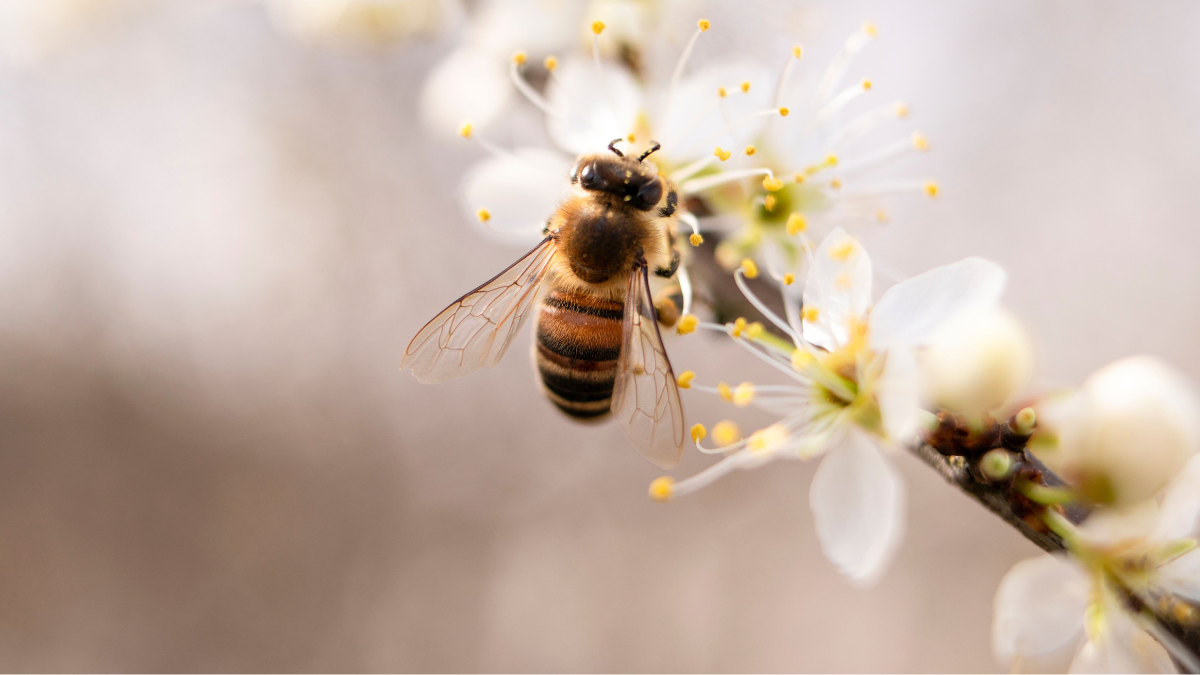
Bees are an attractive species to capture on your mobile phone. They may fit well into the aesthetic imagery of our habitats. But recent studies warn that, in the near future, it might become more convenient to create an AI image of a bee than to spot one in our environment.
There are around 20,400 recorded species of bees in the world. More than 90% do not live in hives or produce honey. This percentage is even higher in India, where, of the approximately 700 bee species, only five are social bees that live in hives and produce honey. The rest are “solitary” bees, with no social hierarchy. These bees live alone, forage and fend for themselves. Moreover, they play an important role in our world.
A new study has reported alarming findings about the fertility traits of these solitary bees. Titled “Lasting impacts of sublethal prepupal heatwaves on fertility-related traits of the solitary bee Osmia bicornis,” the study reveals that simulated sublethal heatwaves during the prepupal stage alter fertility-related traits in solitary bees.
The study investigated the effects of a field-realistic, three-day fluctuating heatwave regime, with temperatures below 40°C and below the critical thermal maximum (CTmax) for this species, replicating the temperature conditions experienced in the UK during July 2022. After the bees overwintered following juvenile exposure, researchers assessed male sperm and female oocytes to examine the effects on reproductive traits.
The study found that, although there was no direct effect on survival to adulthood, male sperm counts were reduced by 33% and sperm motility by 53%, while sperm length was shortened by 17%. In females, oocyte production was reduced by 15%, along with a 17% reduction in terminal oocyte volume.
In bees and many other insect species, testicular development and spermatogenesis usually begin during the prepupal and pupal phases, when the heat stress regime was applied. This period has been found to be thermally sensitive, with heat stress interfering with normal reproductive development. The heatwave simulated in the study may therefore have impaired testicular development and initial sperm production, reducing sperm numbers in adult bees despite the months of overwintering between exposure and assessment.
Reductions in sperm numbers and quality may affect fertilization. Previous research has found that elevated temperatures of 29°C led to decreased sperm abundance, reducing egg fertilization rates and embryo development.
Although this experimental approach does not allow for a detailed exploration of thermal thresholds or breakpoints, it provides valuable insights into the potential biological consequences of ecologically realistic, fluctuating heat stress, as experienced during heatwaves in nature.
Solitary bees are crucial to the pollination of several crops, including cucurbits, blueberries, cranberries, tomatoes, eggplants, apples, plums and almonds, as well as various lentils and other crops. These bees are efficient pollinators because they carry dry pollen across their bodies, potentially making them more effective than honeybees for certain crops.
This is not an isolated area of research. Another study published in 2023 also examined the damaging effects of heat on sperm production in bees, focusing on bumblebees of the genus Bombus.The study found that exposing whole male bumblebees to 4°C for 85 minutes, isolated seminal vesicles to 4°C for 85 minutes ,and whole males to 4°C for 48 hours did not significantly affect sperm viability.
However, after 85 minutes at 45°C, males showed significantly reduced sperm viability. This suggests that short-term heatwaves below the critical thermal maximum could substantially reduce male bumblebee fertility, with potential population-level consequences.
The thermal tolerance of worker bumblebees is relatively high, with a CTmax of approximately 48–55°C, making it unlikely that they would experience these temperatures under ordinary conditions, even with climate warming. However, the thermal tolerance of whole organisms often exceeds that of their reproductive cells. Many insects can be sterilised by exposure to temperatures well below their upper thermal tolerance.
Why Should This Matter?
Pollination, a crucial process for maintaining the planet’s biodiversity and food security, is primarily driven by bees and other insect pollinators.
In agricultural systems, pollinators are essential for producing a wide range of crops, including orchard fruits, horticultural crops and forage, as well as seeds for root and fibre crops. Pollinators contribute to approximately 35% of global crop production by volume, enhancing the yields of 87 of the 115 major food crops and numerous medicinal plants.(FOA data)
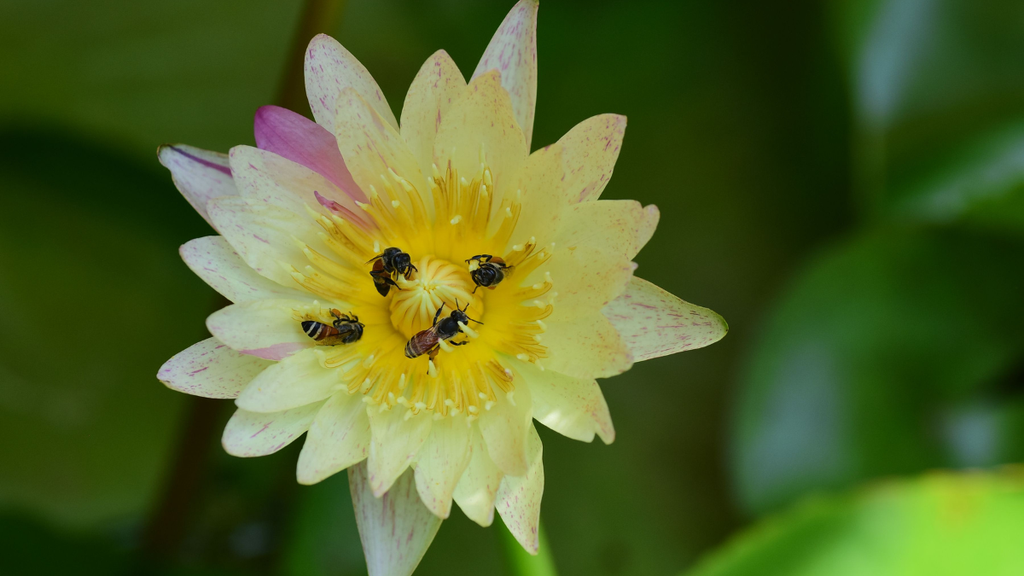
Bees pollinating on a flower.Image credit:Pexels
The benefits of pollination extend beyond improving the quantity and quality of food production. Pollinator-dependent plants contribute to the production of many micronutrients and vitamins that are important for human nutrition and dietary diversity.
The Food and Agriculture Organization (FAO) also points out that more than 80% of wild flowering plant species are pollinated by animals, mostly insects.
Bees and other pollinators face significant threats, with current extinction rates estimated to be 100 to 1,000 times higher than natural background rates due to human activities. According to the International Union for Conservation of Nature (IUCN), national Red List assessments indicate that around 40% of bee species assessed in some regions are at risk of extinction, while 16.5% of vertebrate pollinators are at risk of global extinction.
Habitat loss and fragmentation, intensive farming, monocultures, pesticides, pests, diseases and climate change-related impacts, such as temperature extremes and shifts in flowering times, are major contributing factors to pollinator decline. These pressures can disrupt the balance between flowering plants and their pollinators.
To establish whether the observed reproductive changes translate into fewer offspring, declining populations or substantially reduced pollination under real-world conditions, further research and evidence are needed. However, habitat fragmentation, climate change, extreme heat and biodiversity loss are already placing increasing pressure on ecosystems. Understanding how these stressors affect the reproductive capacity of bees is therefore essential to assessing the potential long-term consequences for biodiversity and food security.
Climate
Climate Science Faces a Deadline: Can the IPCC Deliver Before the 2028 Global Stocktake?
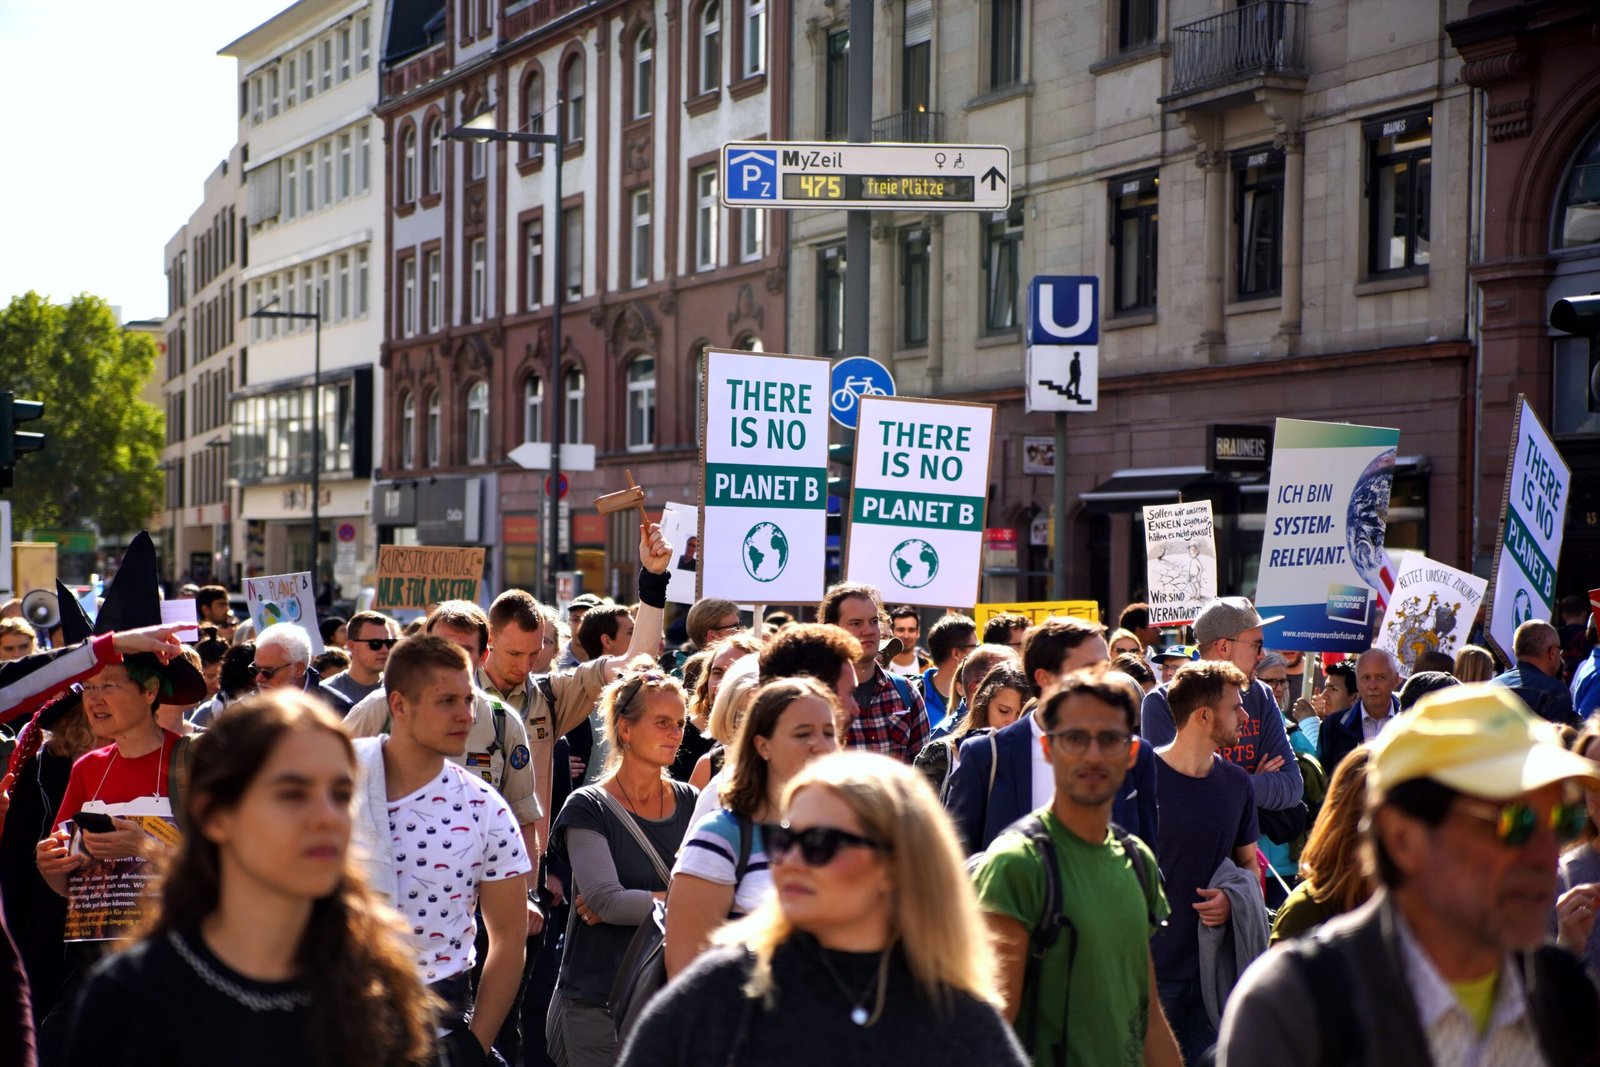
Climate protesters demand stronger action on global warming, highlighting the urgency of translating climate science into effective policy and international commitments.
Disagreement over the publication schedule of the world’s leading climate assessment has exposed a growing tension between the urgency of climate action and the need for equitable scientific participation.
The world’s leading climate science body is approaching a critical decision over when to publish its next major assessment, raising concerns that governments could enter the next phase of global climate negotiations without a comprehensive review of the latest climate science.
The Intergovernmental Panel on Climate Change (IPCC) has repeatedly failed to reach agreement on a timeline for its Seventh Assessment Report (AR7), with disagreements among member countries continuing for nearly three years. The dispute comes ahead of the second Global Stocktake under the Paris Agreement, scheduled to conclude in 2028, when countries will assess collective progress towards addressing climate change.
A Reuters report published on October 9 reported that the deadlock could complicate international climate negotiations. The disagreement centres on whether the IPCC should complete its three main working-group assessments in time to inform the 2028 process or allow additional time for drafting, review and approval.
The IPCC’s assessments inform international climate agreements and national decisions on emissions reduction, adaptation and climate finance. A delay could therefore affect not only when scientific findings become available, but also how governments use them to shape their next climate commitments.
A clash between urgency and equitable participation
The disagreement has exposed differences between countries over the pace of climate action and the conditions required to produce credible scientific assessments.
More than 30 countries, including European nations and small-island states, have supported efforts to complete the assessments in time for the 2028 Global Stocktake. They argue that governments need the most recent scientific evidence when evaluating whether existing climate commitments are sufficient.
Other countries, including India, China, Russia and Saudi Arabia, have called for more time. They argue that a compressed timetable could undermine the ability of researchers and governments in developing countries to review the reports and participate meaningfully in the assessment process.
These concerns matter because IPCC assessments involve extensive scientific drafting, expert review and government scrutiny. Researchers from countries with fewer resources may face constraints in funding, research infrastructure and the time available to contribute to a process that relies heavily on scientific expertise.

Electric vehicle charging point in an urban city.Representational image.Image credit:Pexels
However, the disagreement has also prompted concerns that a delay could weaken the connection between climate science and international decision-making. The competing positions raise a fundamental question: how can the IPCC ensure both timely assessments and fair participation without compromising scientific quality?
Carbon Brief reported in April that governments had failed to agree on the timeline across five consecutive IPCC sessions. The IPCC chair, Jim Skea, said the impasse had produced little progress on resolving the issue, although work on the assessments was continuing.
The disagreement does not mean that climate research has stopped. Scientists are continuing to draft the working-group reports, but uncertainty over the final schedule creates difficulties for planning reviews, meetings and the wider assessment process.
Why the 2028 deadline matters
The Global Stocktake is a central mechanism of the Paris Agreement. It evaluates how far countries have progressed towards the agreement’s goals and informs subsequent national climate plans.
The second stocktake is due to conclude in 2028 at COP33. If the IPCC’s working-group reports are not ready in time, negotiators could have to rely on existing assessments alongside other available scientific evidence.
The IPCC’s Seventh Assessment Report covers three broad areas: the physical science of climate change; climate impacts, adaptation and vulnerability; and options for reducing greenhouse gas emissions. Together, these assessments help governments understand the scale of climate risks and the choices available to address them.
The upcoming IPCC-65 meeting in Addis Ababa, Ethiopia, scheduled for October 12–16, is therefore an important opportunity for governments to seek agreement on the timetable. The outcome could determine whether the assessment process remains aligned with the 2028 stocktake.
For India and other developing countries, the debate has implications beyond scheduling. Their participation in climate assessments can influence how regional vulnerabilities, development priorities and adaptation needs are represented in the scientific evidence used by policymakers.
The challenge for the IPCC is to reconcile two objectives: delivering scientific findings when governments need them and ensuring that the process includes researchers from across regions and income levels.
As the meeting approaches, the question is no longer simply when the next climate assessment will be published. It is whether the international community can establish a timeline that preserves scientific credibility, broad participation and the usefulness of climate evidence for decisions that will shape the planet’s warming future.
Health
Extreme Heat Threatens Pregnancies, Exposing Gaps in Climate Adaptation Plans
Extreme heat is emerging as a growing threat to pregnancy and childbirth. Research from India and an international survey highlight the risks to maternal and newborn health, underscoring the need for stronger healthcare protections and climate adaptation plans.
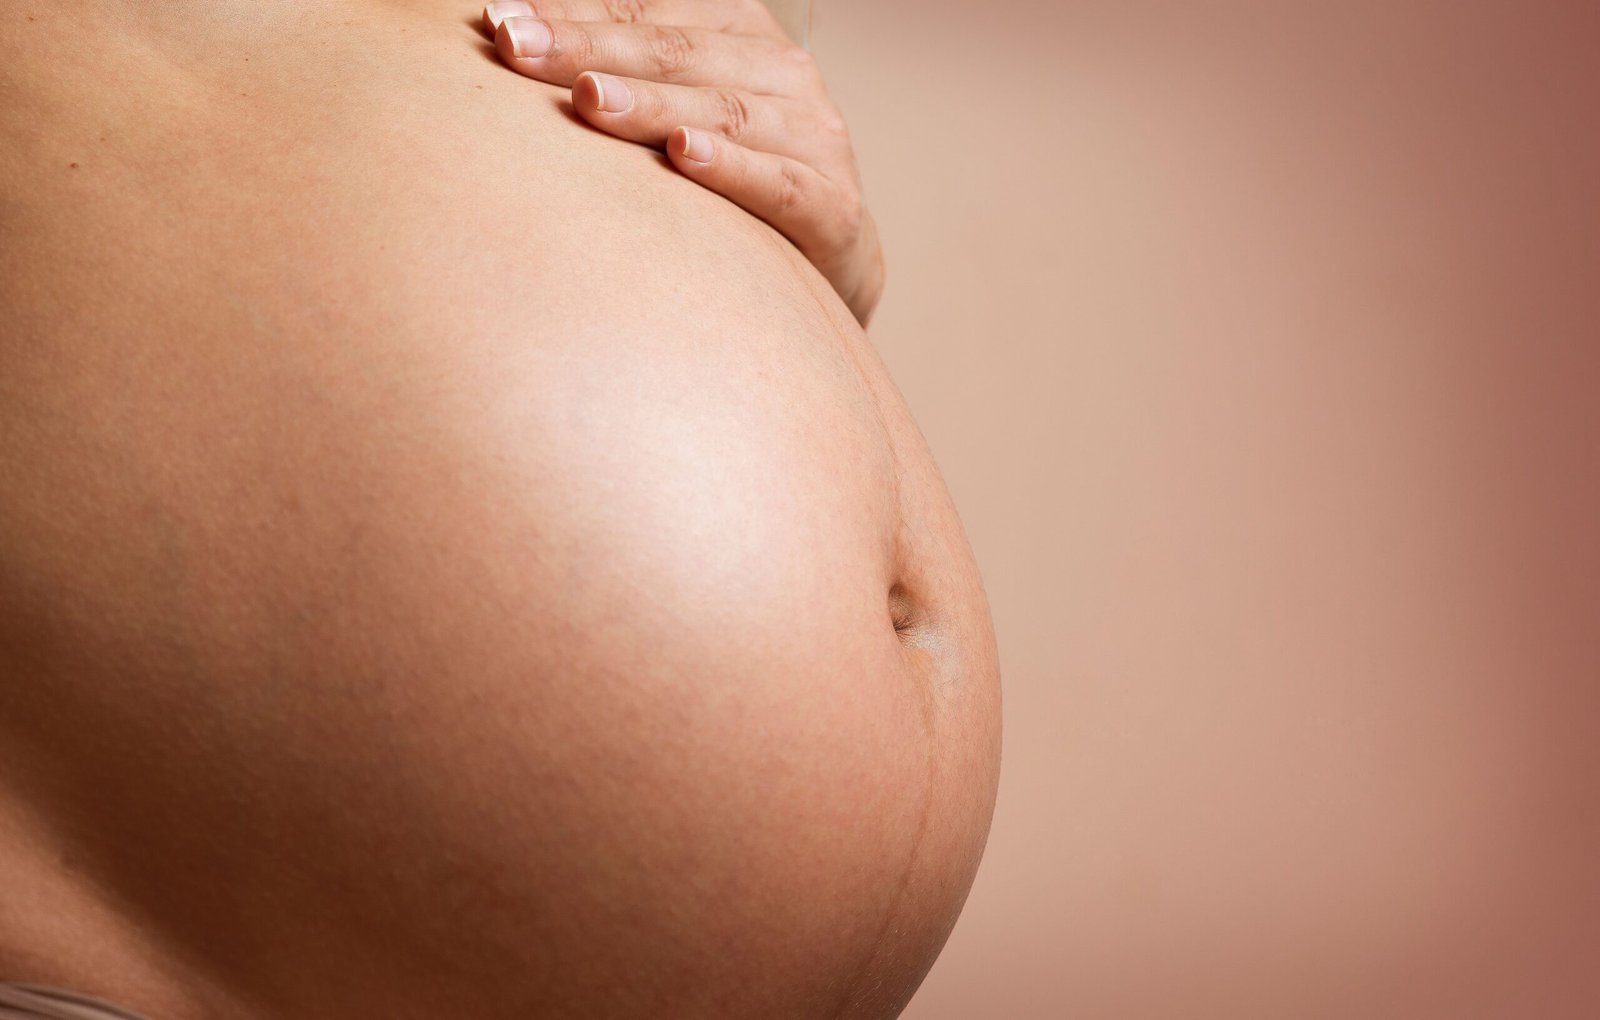
Evidence from Tamil Nadu and a new international survey shows how rising temperatures threaten maternal and newborn health, with outdoor workers and rural women facing particular risks.
Extreme heat is emerging as a growing threat to pregnancy and childbirth, but climate adaptation plans risk overlooking the women and newborns most vulnerable to its effects. New international survey findings, alongside research from Tamil Nadu, point to a widening public-health challenge as rising temperatures threaten maternal health and expose inequalities in access to safe healthcare.
At least 73% of maternal healthcare professionals surveyed across five countries reported an increase in heat-related cases or complications affecting pregnant women over the past five years, according to a survey commissioned by global charitable foundation Wellcome. Meanwhile, 76% reported an increase in heat-related complications affecting foetal or newborn health.
The findings were highlighted by Simon Stiell, executive secretary of the United Nations Framework Convention on Climate Change (UNFCCC), at an event organised by Wellcome during the Pre-COP ministerial meeting in Fiji on October 5, ahead of the COP31 climate conference in Türkiye in November.
“Rising temperatures mean rising danger in pregnancy,” Stiell said, pointing to links between extreme heat during pregnancy and premature birth, stillbirth, low birth weight and maternal complications.
The survey covered 1,000 maternal healthcare professionals working in Australia, Brazil, India, the United Kingdom and Zimbabwe. It found that 81% were concerned that extreme heat would increasingly threaten maternal, foetal and newborn health without further action. Nearly all respondents had cared for a pregnant woman or baby whose health they believed had been affected by extreme heat, while 92% wanted more training and resources to protect pregnant women.
The findings highlight a critical gap in climate preparedness: although heat-health warnings are becoming increasingly important, pregnancy and newborn care are not always adequately incorporated into plans for responding to extreme temperatures.
Evidence from India highlights unequal risks
Research from Tamil Nadu adds to the growing evidence that occupational heat exposure can have serious consequences for pregnancy.
A prospective cohort study published in BJOG: An International Journal of Obstetrics & Gynaecology examined 800 pregnant women engaged in moderate to heavy physical work in Tamil Nadu. Researchers found that 47.3% experienced high occupational heat exposure. Among heat-exposed women, 29.6% experienced moderate dehydration, while 17.4% recorded an increase in core body temperature.
The study found that women exposed to high occupational heat had 2.4 times the adjusted odds of miscarriage and 2.3 times the adjusted odds of an adverse pregnancy outcome. The latter included outcomes such as miscarriage, preterm birth, low birth weight and stillbirth.
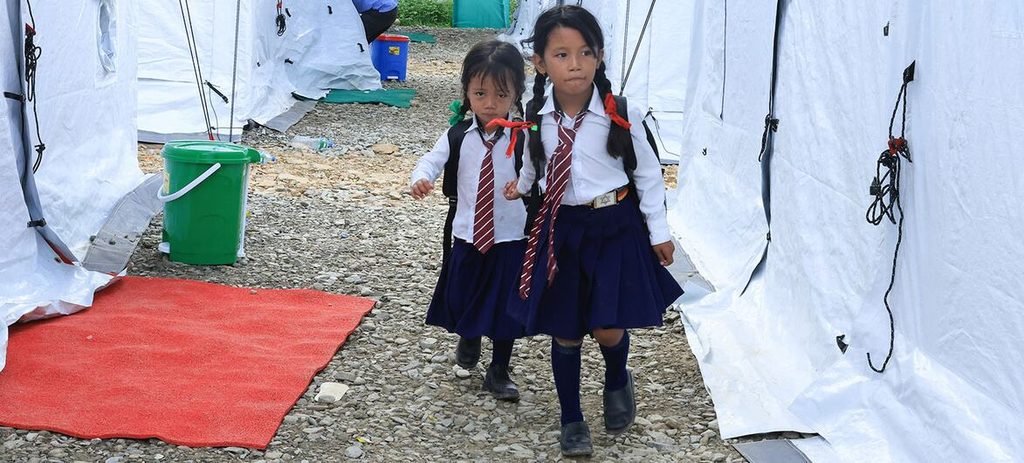
Children are attending school in temporary learning centres following the devastating floods in Nuwakot, Nepal, where climate change and glacial ice melt have played a significant factor.Image credit: UNICEF/Laxmi Prasad Ngakhusi
The researchers also found that high occupational heat exposure was associated with twice the adjusted odds of an adverse outcome at birth. Although the study establishes an association rather than proving that heat alone caused each outcome, it provides evidence of the risks faced by pregnant women working in hot conditions.
A separate observational cohort study involving 680 pregnant women across six Tamil Nadu districts examined differences between rural and urban populations. Researchers found that 55% of rural participants experienced heat exposure above the study’s permissible limit, compared with 45% of urban participants.
Rural women were also more likely to report heat-strain symptoms, including excessive thirst, fatigue, headaches and dizziness. After accounting for potential confounding factors, heat-exposed rural women had nearly twice the risk of adverse pregnancy outcomes and three times the risk of adverse birth outcomes compared with the study’s urban comparison group.
The study also found a fourfold higher risk of miscarriage among heat-exposed rural women during the first trimester compared with urban women. The researchers identified socioeconomic disadvantage, limited awareness of heat risks and reduced access to welfare facilities as factors that could contribute to rural women’s greater vulnerability.
Evidence from a separate study of 126,273 pregnancies recorded in India and Pakistan reinforces the concern. Researchers found that higher average maximum temperatures during the second trimester were associated with an increased risk of preterm birth. The relative risk was 1.05 for the study’s five-degree temperature contrast, indicating a 5% relative increase in risk—not a five-percentage-point increase in the absolute risk of premature birth.
Together, these studies suggest that heat exposure is not simply an environmental inconvenience during pregnancy. It can coincide with dehydration, physically demanding work and barriers to healthcare, creating risks that are unevenly distributed across communities.
From warnings to protection
Stiell warned that the effects of extreme heat are not shared equally. Pregnant women who work outdoors, live in poorly ventilated housing, travel long distances to clinics or depend on healthcare facilities without reliable electricity, water or cooling cannot be protected through public advice alone.
“Staying cool” is not a realistic option for families without access to cool spaces, he argued. Without targeted intervention, extreme heat could deepen existing inequalities in maternal healthcare, making a safe pregnancy increasingly dependent on income, geography and access to medical services.
Stiell outlined three priorities for governments: integrating pregnancy and newborn care into climate adaptation and heat-health planning; translating evidence into practical protection through healthcare-worker training, heat alerts and safer facilities; and improving data to identify where risks are growing and which interventions are effective.
For India, the findings have implications for heat-action plans, occupational safety and maternal healthcare. Measures could include heat-risk guidance during antenatal visits, better protection for pregnant outdoor workers, improved ventilation and cooling in maternity facilities, and reliable access to water and electricity during extreme heat.
The UN climate chief also called for adaptation-finance commitments agreed at COP30 in Belém, Brazil, to be delivered and for countries to work towards mobilising $1.3 trillion annually for developing countries.
Health is expected to remain a key priority in preparations for COP31, scheduled for November 9–20, 2026, in Türkiye’s Antalya province, under the Turkish presidency and with Australia leading negotiations.
The emerging evidence makes the policy challenge clear: protecting pregnant women and newborns must become part of climate resilience, rather than an afterthought. As temperatures rise, governments will need to assess climate action not only by emissions targets and financial commitments, but also by whether healthcare systems can protect people during pregnancy and give newborns a safe start to life.


Heatwaves are Affecting Fertility Traits in Bees.

Why Some People Age Better Than Others May Be Written in Their Blood

AI Models Could Soon Spread Across Smart Devices, Raising Cybersecurity Fears

WHO Urges Lifestyle-first Approach as 170 Million Children and Adolescents Live with Obesity

Centre Asks States to Ensure Hospitals Display Service Charges

From Scams to Screens: How the National Stock Exchange Rewrote India’s Equity Story

Knowing When to Think for Ourselves: AI, Intuition and the Education of Discernment

After a Scorching Summer, Delhi’s Children Are Slow to Return Outdoors

Two Chemists Win Nobel Prize for Solving a Century-Old Puzzle: Why Life Picks One Hand Over the Other

India’s AI Moment Rests on More Than Code

-

 Math3 months ago
The 2026 Fields Medals: Four Proofs, Four Decades-Old Problems Solved
-
EP Deep Dive: Data & Solutions3 months ago
After Kerala’s Deadliest Landslide, the Hardest Thing to Rebuild Was Childhood
-
EP Deep Dive: Data & Solutions3 months ago
West Asia Crisis: Can Kerala’s Returning Gulf Migrants Find a Future in the Green Economy?
-
Space & Physics5 months ago
India Semiconductor Mission: ‘It’s Not About Fabs. It’s About Building An Entire Ecosystem’
-
Interviews3 weeks ago
From Scams to Screens: How the National Stock Exchange Rewrote India’s Equity Story
-
Climate4 months ago
The Climate World Cup? How Climate Change Could Affect Player Performance at the 2026 World Cup
-
Society3 months ago
What Is Civilisational Diplomacy? Understanding India’s Newest Foreign Policy Tool
-
Society4 months ago
From Bell Labs to the Classroom: A Second Career in Teaching