
Sustainable Energy
IEA’s New Report on What Would a Net-Zero Compatible Electricity System Require
Global electricity demand is rising rapidly, but building a net-zero-compatible power system will require far more than new generation. The IEA outlines the grids, storage and flexibility needed to keep pace.

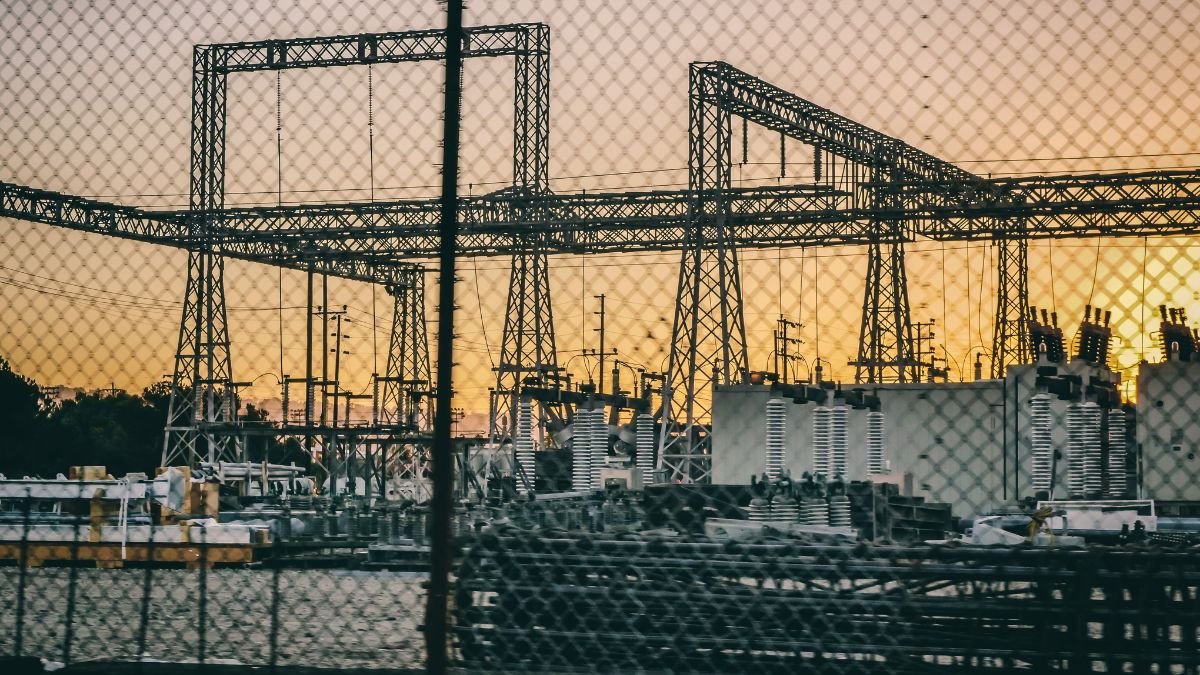
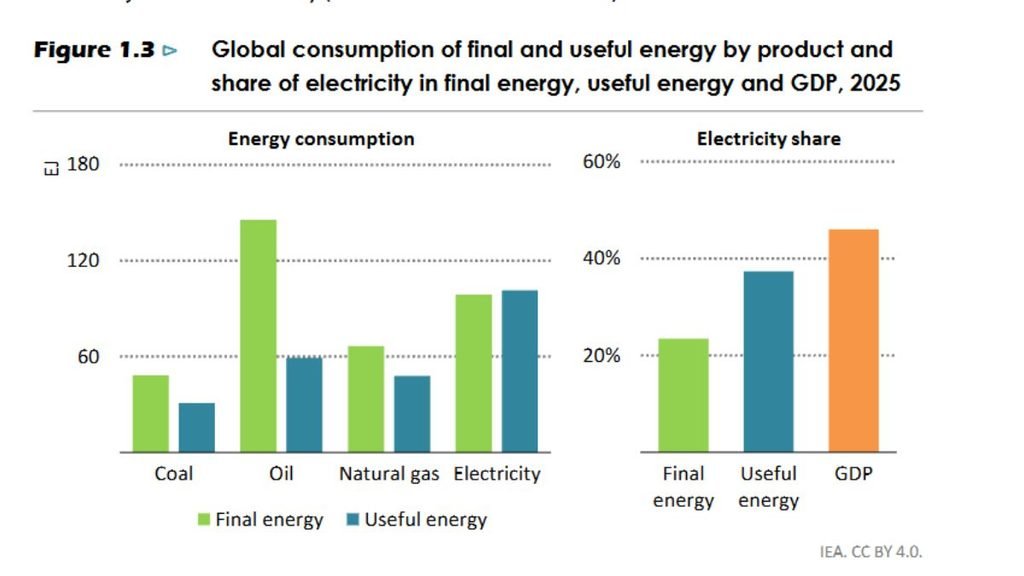
An electric car plugged in at night, a heat pump warming a home and a factory replacing a gas-fired process with an electric one may look like separate changes. They are becoming part of the same transformation or some say, the age of electrification. The change is already underway if we look closer. Global electricity demand exceeded 28,500 terawatt-hours in 2025 and has grown by more than 3% a year over the past decade, almost twice as fast as overall energy demand.
The International Energy Agency’s latest Special Report on Electrification points to the same scale of change. Its High Electrification Scenario, or HES, sees electricity rising from 23% of global final energy consumption today to 35% by 2035. The scenario is designed to be compatible with the IEA’s net-zero pathway when combined with measures such as energy efficiency.
That would mean another 1,400 TWh of electricity demand every year through 2035, about twice the annual increase recorded during the previous decade. But are we ready to keep up with this mass consumption?
Jan Rosenow, Professor of Energy and Climate Policy at Oxford University, said the technologies needed for faster electrification are already available, but current progress remains insufficient.
“Electrification is the most important lever we have to build a clean, secure and affordable energy system. today’s report shows the technologies are ready and the economic case is strong, but current progress falls well short of what is needed. We are still in the middle of an energy crisis with crippling oil and gas prices and governments must now act across every sector, from buildings and transport to industry.”
A Rapid Power Build-Out
Much of the new demand is likely to come from activities that currently depend on fossil fuels. The IEA estimates that, using current costs, prices and financing conditions, the share of electricity in final energy use could rise from 23% to around 33% globally through cost-effective opportunities alone. The HES pushes that further, to 35% by 2035.
But that extra electricity cannot simply come from whatever power plants happen to be available. Electricity generated from low-emissions sources accounted for 42% of global generation in 2025, up from 33% in 2015. Solar deployment increased more than tenfold during the decade and wind deployment more than doubled.
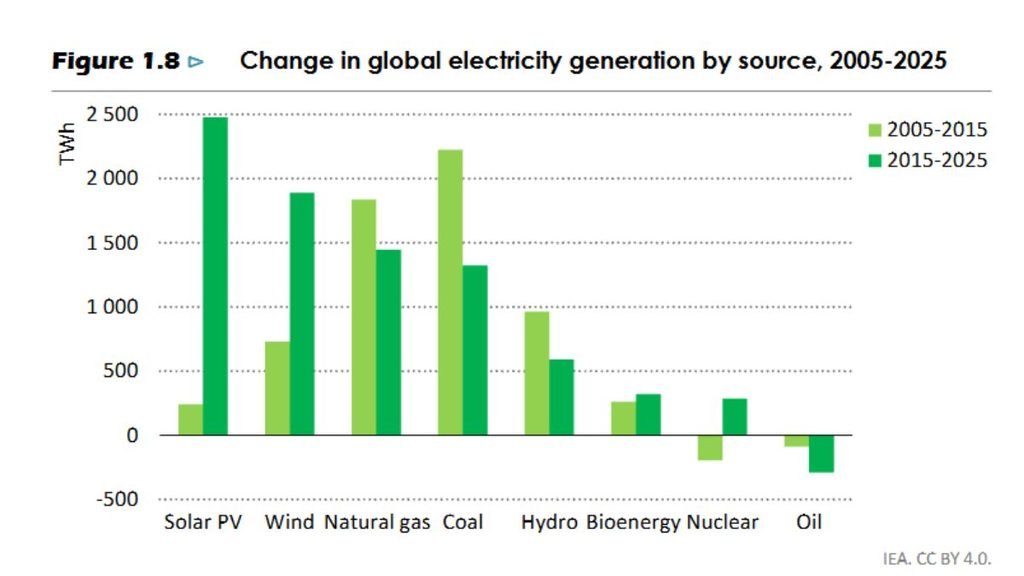
At the same time, fossil-fuel generation also increased. Power generation still produces around 14 billion tonnes of CO₂ a year, and global power-sector emissions have not yet peaked. For a net-zero-compatible system, the problem is therefore twofold: generate much more electricity while changing what generates it.
Janet Milongo, Senior Manager Energy Transition at CAN International, said the proposed 35-by-35 target would need to be assessed not only by how much energy becomes electric, but by how that electricity is generated and governed.
“The 35 by 35 target will only represent climate progress if it is powered by sustainable renewable energy. Success cannot be measured simply by how much of the world’s final energy consumption becomes electric. We must ask what generates that electricity, who has access to it, who owns the infrastructure, and whether it is helping countries transition away from fossil fuels. Developing countries must have the resources and capacity to own, govern and shape their electricity systems in the public interest.”
Solar Panels are Only the Beginning
By 2035, annual solar additions would need to exceed 1,200 GW, while annual wind additions would reach around 400 GW. Nuclear power would also expand substantially. This would provide electricity for the new demand created by electrification while replacing part of the fossil-fuel generation already on the system.
If an electric vehicle is charged with electricity produced by a fossil-fuel power plant, the energy system has changed, but its emissions have not disappeared. Electrification can deliver its full climate benefit only as the electricity supplying it becomes cleaner.
The same applies to factories, buildings and other major users. The result is a system that needs to expand generation at the same time as it changes its composition. That makes the transition more demanding than simply replacing one technology with another.
The Problem of Transfering Power
None of the sources of electricity can serve a household or factory without a network connecting generation to demand. The IEA estimates that the global electricity network would need to reach around 115 million kilometres by 2035 under the HES, with network expansion accelerating by about 40% compared with the previous decade.
That is a major infrastructure requirement, particularly because the geography of electricity supply and demand is changing. Solar generation is concentrated in certain hours. Wind output varies with weather. New renewable projects may be located far from industrial centres or cities. Meanwhile, electric vehicles, cooling and heating can create new peaks in demand.
A system built for relatively predictable electricity flows therefore has to become much more flexible. The IEA identifies connection queues, grid congestion and renewable curtailment among the problems that could slow the transition. Building transmission and distribution infrastructure earlier, improving the use of existing networks and speeding up planning and permitting become part of the climate strategy.
The grid is no longer simply the infrastructure that delivers electricity after it has been generated. It becomes one of the conditions for adding more clean generation in the first place.
Demand Side Matters
Storage is one response to this changing system. Under the IEA’s net-zero pathway, battery storage capacity would rise to around 2,900 GW by 2035, almost ten times current levels.
But the report’s picture of flexibility is broader than batteries. An electric vehicle does not necessarily have to charge at the moment it is plugged in. Some industrial processes can be shifted. Heating and cooling systems can respond to changing electricity availability. Water heaters can operate at times when the grid has more capacity.
That means electricity demand itself can become more flexible. This could become particularly important in countries where solar generation peaks during the day while electricity demand rises later in the evening.
India is one example. The country has been adding solar capacity while its electricity demand increasingly extends into evening and night-time hours. A larger solar fleet can increase daytime supply without automatically solving an evening peak.
How much electricity generated can move, store or shift to when people need it?
Richer Countries: Different Problem
In wealthier economies, electricity access is largely established. The challenge is what happens when an existing system suddenly has to serve much more demand and more variable sources of supply.
Electric vehicles, cooling, heat pumps, data centres and industrial electrification can all add load. At the same time, many of these countries have grids and power infrastructure designed around older patterns of electricity consumption. Some networks will need to be strengthened or replaced; others will need better digital controls to manage increasingly complex electricity flows.
There is also a financial problem at the household level. An electric technology can cost more to purchase while costing less to operate. That creates a barrier for households and businesses that cannot afford the initial investment, even when the technology may make economic sense over its lifetime. The IEA therefore sees financing and targeted support as part of the electrification challenge rather than as an issue separate from the energy transition.
India Sits Across Both Worlds
India illustrates how different parts of the challenge can exist within the same electricity system. Electricity demand grew by around 5% a year between 2015 and 2025. The country is also rapidly expanding renewable generation and electrifying transport.
There is significant room to electrify industrial processes. Nearly 30% of India’s industrial heat demand is below 150°C, a range where the IEA identifies substantial potential for electrification. Electric two- and three-wheelers provide another important opportunity.
But the changing timing of electricity demand creates a separate challenge. As solar generation grows during daylight hours, demand continues into the evening and night. That makes storage, flexible demand, electricity pricing and better use of the grid increasingly important. India therefore faces both sides of the global transition: expanding access to reliable electricity and preparing an already large electricity system for a much more electricity-intensive economy.
Test Between Generation and Consumption
The IEA’s proposed “35-by-35” target is ultimately a measure of how deeply electricity could enter the global energy system by 2035. But reaching that level would require much more than a larger supply of electricity.
It would require clean generation to grow fast enough to meet new demand and replace fossil generation. It would require transmission and distribution networks to expand before they become bottlenecks. It would require batteries and other forms of storage, alongside demand flexibility, to manage when electricity is produced and consumed.
Dave Jones, co-founder of Ember, described faster electrification as having benefits across household costs, emissions and energy security.
“Today’s report gives us the evidence we have all been waiting for to show that faster electrification is a triple win. A win for cheaper bills, a win for less emissions and pollution, and a win for cutting the huge fossil fuel import bill many countries face today.”
And it would require very different approaches in different parts of the world. In advanced economies, the priority is largely to transform and expand existing systems. In countries with major access gaps, electricity infrastructure has to grow alongside basic services and economic activity. Countries such as India are dealing with both challenges at once.
The technologies for much of this transition already exist. The harder task is putting them together at the required scale — and making sure the money, infrastructure, skills and institutions move with them.
That is the central question behind a net-zero-compatible electricity system: not simply whether the world can produce more electricity, but whether it can build an electricity system capable of carrying an increasingly electrified economy without carrying fossil-fuel emissions along with it.













Sustainable Energy
How a Middle East Conflict Is Reshaping the Global Coal Market
Global coal demand is forecast to rise 1.2% to a record 8.94 billion tonnes in 2026, with higher gas prices linked to the Middle East conflict encouraging coal use in parts of Asia and Europe. The IEA expects demand to ease in 2027 if LNG supplies recover.
The Strait of Hormuz carries very little coal. Yet disruption there has become one of the forces shaping the international coal market in 2026. The reason is natural gas. Falling LNG shipments through the Strait pushed gas prices higher after the conflict in the Middle East intensified. In countries that have both gas-fired power plants and coal capacity available, the economics began to favour coal. Japan and South Korea, both heavily dependent on imported energy, increased their demand for traded coal. Higher gas prices also affected power markets in Europe and China.
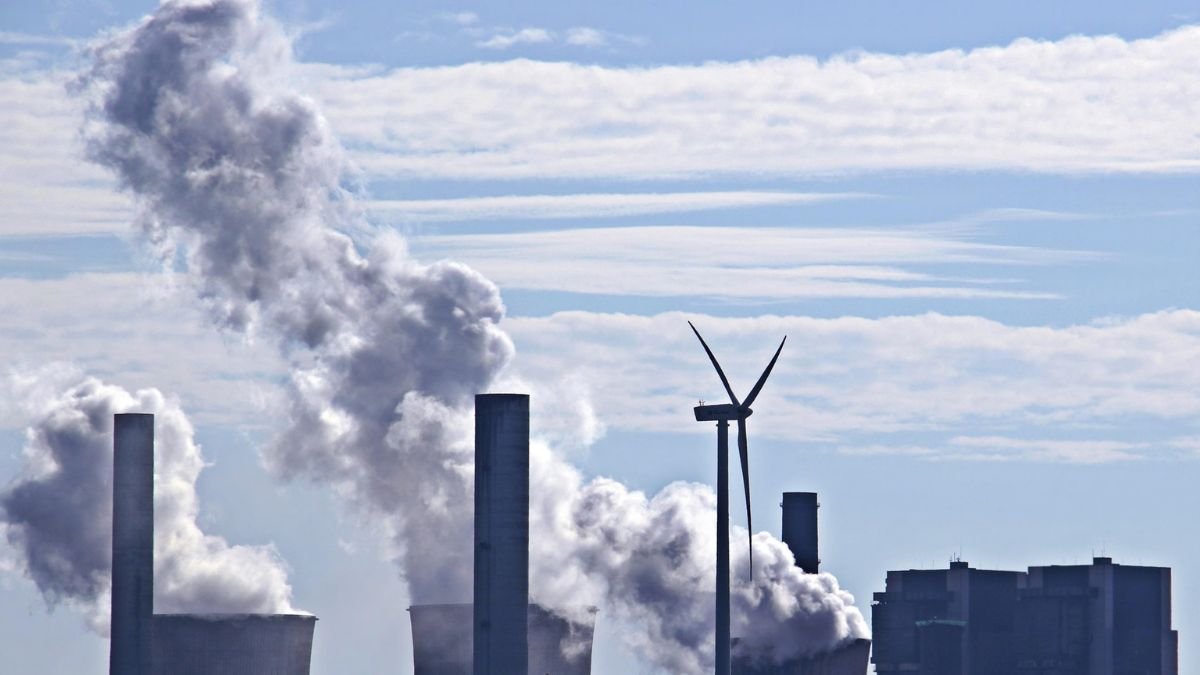
A geopolitical crisis far from the world’s main coal mines has helped revive demand for a fuel that many economies have been trying to reduce. The International Energy Agency now expects global coal consumption to rise 1.2% in 2026, reaching 8.94 billion tonnes and setting another record. Its previous outlook had pointed towards a small decline. The revision came largely from the effects of the Middle East conflict and weather-related factors. How long that revival lasts will depend heavily on what happens to gas.
Coal is Benefiting from a Gas Shock
The connection between LNG and coal is central to the current market. The conflict has disrupted LNG flows through the Strait of Hormuz, raising concerns about gas availability and prices. Coal has consequently become more competitive in power markets where generators can switch between the two fuels.
Japan and South Korea are particularly important because their power systems rely heavily on imported fuels. The IEA says gas-to-coal switching in these markets has increased demand for internationally traded coal. Europe has experienced a similar, though more limited, effect. The impact should not be mistaken for another 2022-style coal shock.
During the energy crisis that followed Russia’s invasion of Ukraine, international coal prices surged above 400 dollars a tonne across major benchmarks. The first half of 2026 has been considerably less dramatic. Newcastle thermal coal averaged 139 dollars a tonne in June, and stood at 131 dollars a tonne in August. The market has tightened, but it is not experiencing the kind of supply panic seen four years ago.
Asia is Where the Coal Trade is Being Tested
China remains the largest force in the global coal market, but its role in international trade is changing. For years, rising Chinese coal imports helped compensate for declining imports elsewhere. That changed in 2025. Chinese imports weakened and global coal trade contracted, while growing purchases in Southeast Asia were not large enough to make up the difference.
China’s domestic market also became more complicated in 2026 after a fatal coal-mine accident in Shanxi province triggered safety inspections. Production fell sharply in June and July, tightening domestic supplies, particularly of coking coal. That disruption is changing where China obtains some of its metallurgical coal.
Mongolian coking coal exports to China are expected to rise by more than 50% in 2026, reaching about 91 million tonnes. Much of that coal moves by rail, giving Mongolia a larger role in supplying the Chinese steel industry as domestic production faces disruption. The shift is significant because it shows how quickly coal trade routes can change when domestic supply is interrupted.
Southeast Asia is Becoming the Other Growth Centre
The longer-term coal story is moving east as mature markets reduce consumption. Coal demand across ASEAN is expected to reach about 574 million tonnes in 2026. Indonesia and Vietnam account for much of the growth. Indonesia is particularly important because coal remains deeply embedded in its electricity system and in captive power generation for energy-intensive industries such as nickel, cement and aluminium.
Vietnam faces a different combination of pressures. Heatwaves have increased electricity demand, while the need to replenish coal stocks has supported imports. The IEA also expects El Niño conditions to put further pressure on coal demand by increasing cooling requirements and reducing hydropower output.
These markets are expanding at a time when Japan, South Korea and the European Union are moving in the opposite direction. That divergence is becoming one of the defining features of the international coal trade.
Europe is Still Moving Away from Coal
Europe has not reversed its coal phase-down. Higher gas prices have simply slowed the decline. The IEA expects EU coal demand to reach 276 million tonnes in 2026. The fall is expected to be less pronounced than previously forecast because higher gas prices have made coal more attractive in countries such as Germany and Poland, where coal capacity remains available.
The broader direction remains unchanged. Renewable generation is expanding, nuclear availability is improving in some markets, coal phase-out policies remain in place and industrial coal demand is weakening. The IEA therefore expects the structural decline in European coal consumption to continue.
The current increase in coal use is better understood as a response to an unusual gas-price environment than as a reversal of Europe’s energy transition.
Exporters are Feeling the Shift Differently
The changes in demand are creating winners and losers among coal exporters. Indonesia, the world’s largest thermal coal exporter, is expected to reduce production in 2026. Lower production targets and export-related regulatory measures have tightened expectations for seaborne supply. Australia is better positioned to fill part of the gap.
Australia remains the dominant exporter of metallurgical coal and is expected to ship more than 150 million tonnes in 2026. Russia is also expected to remain an important supplier to Asian markets, although sanctions, logistics constraints and higher export costs continue to weigh on its competitiveness.
For Russia, the geography of the coal trade has changed substantially since European sanctions disrupted its traditional markets. Its Far Eastern ports provide better access to Asian buyers, while Black Sea and Baltic shipments face greater pressure from route economics and market access. Russian coal therefore remains competitive in parts of Asia, but generally at a discount to Australian and South African benchmarks. The result is a coal market increasingly organised around Asian demand and the ability of exporters to reach it.
The Coal Trade is Already Preparing For a Downturn
The current recovery may prove temporary. If LNG flows through the Strait of Hormuz return towards pre-conflict levels and gas prices fall, much of the incentive for gas-to-coal switching will disappear. The IEA consequently expects global coal demand to fall by 0.4% in 2027 to 8.91 billion tonnes under that scenario.
The same pattern appears in international trade. Coal shipments are expected to resume their decline in 2027, with thermal coal trade falling across much of Asia and Europe. China is expected to remain the biggest drag on imported thermal coal, while the European Union, Japan, South Korea and Chinese Taipei continue their longer-term reductions in imports. Southeast Asia is expected to remain an exception, with Viet Nam and the Philippines providing some growth. It will not be enough to compensate for the declines elsewhere.
Metallurgical coal is likely to hold up better. India’s expanding steel production and limited domestic supplies of high-quality coking coal are expected to increase imports, offsetting weaker demand from China and other mature markets. Australia stands to capture much of that additional trade.
Geopolitics and Interconnected Fuel Markets
The most revealing part of the 2026 coal outlook may not be the record consumption figure. It is the route by which the increase has happened. A disruption affecting LNG has altered gas prices. Higher gas prices have changed the economics of electricity generation. That has increased coal demand in countries with the ability to switch fuels, tightened some international coal markets and altered trade flows between producers and consumers.
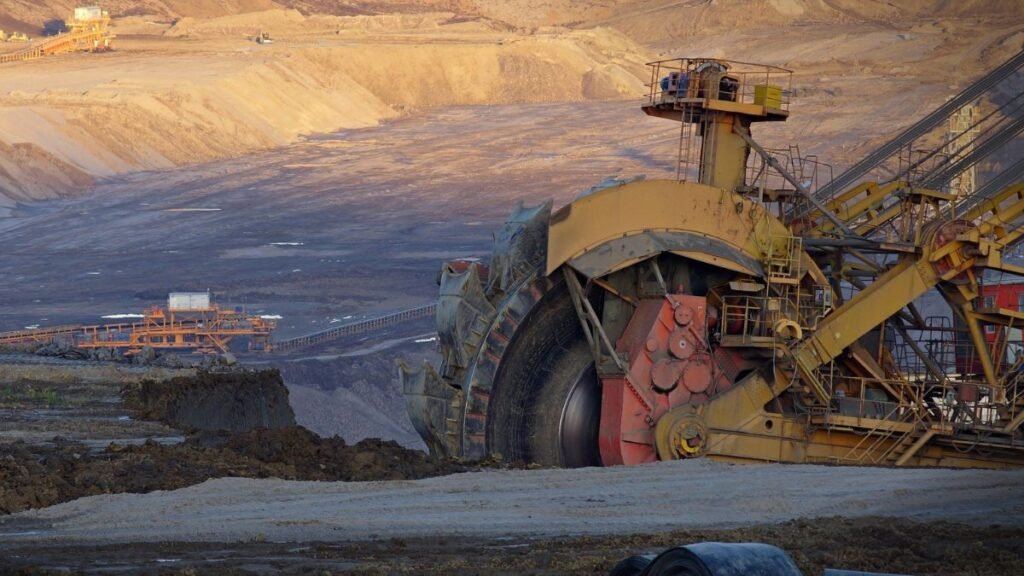
The effect is temporary in some markets and structural in others. Japan, South Korea and the European Union are still on a longer-term path towards lower coal consumption. China is producing more of its own coal and importing less thermal coal. Southeast Asia is adding coal demand as electricity consumption and industrial activity expand. India remains an important source of both thermal and metallurgical coal demand.
For the international coal market, that leaves two forces pulling in opposite directions: a short-term geopolitical shock that has made coal more valuable in some power systems, and a longer-term transition that is steadily shrinking its role in several major economies. The direction of the market in 2027 may depend on which one proves stronger.
Sustainable Energy
Carbon Is Becoming a Cost of Trade. Where Does India Stand?
Carbon pricing is moving beyond climate policy and into global trade. As the UK prepares its carbon border mechanism, India’s carbon market faces a crucial test: can it protect export competitiveness while pushing industries towards cleaner production?
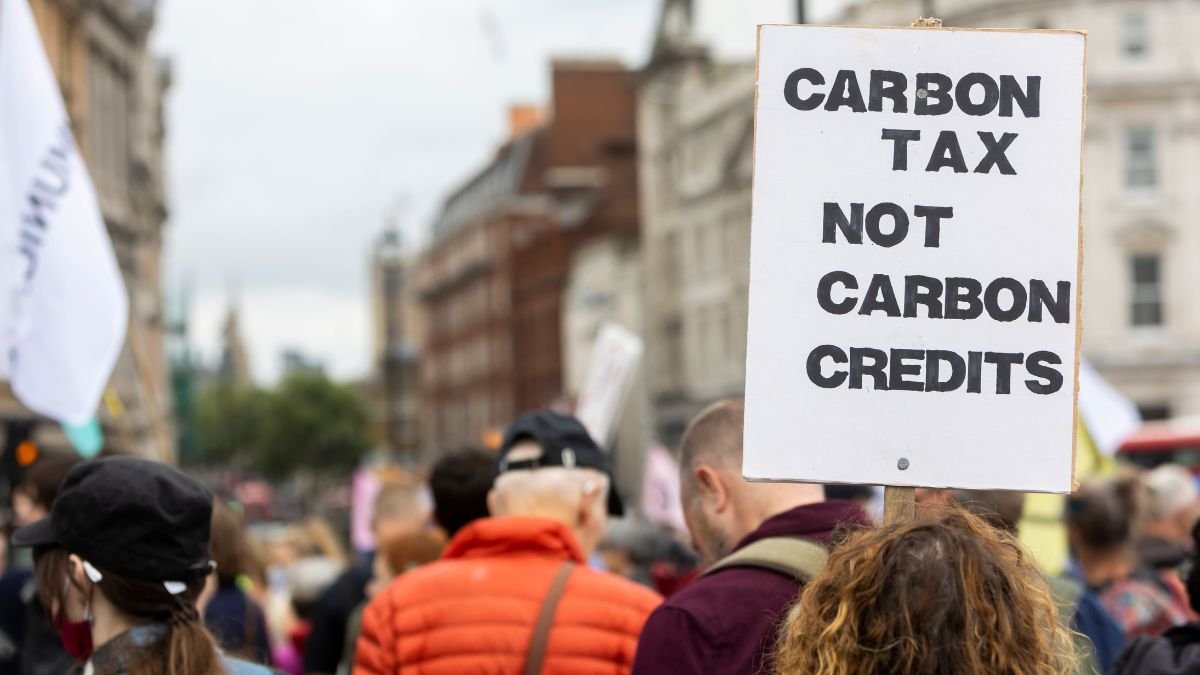
For years, carbon pricing was mostly discussed as a climate-policy question. But from next year, it will also increasingly be a trade question. The UK has included India’s Carbon Credit Trading Scheme (CCTS) in its list of overseas carbon-pricing systems that qualify for relief under its Carbon Border Adjustment Mechanism (CBAM). Britain’s CBAM begins on January 1, 2027, covering imports such as iron and steel, aluminium, cement, fertilisers and hydrogen.
For Indian exporters, the important part is simple: where an eligible carbon price has already been paid in India, the UK can take it into account when calculating the carbon liability at its border. The recognition is not an exemption and does not mean every Indian exporter will automatically receive relief. The actual amount depends on the carbon price paid, the emissions embedded in the goods and the evidence provided.
Almost $1 Billion in Steel and Aluminium Exports
The stakes are not trivial. India exported $13.44 billion in merchandise to the UK in 2025–26. Iron, steel and related products accounted for about $893.4 million, while aluminium exports were around $94 million. Together, those two categories were worth nearly $1 billion.
That does not mean $1 billion will be subject to CBAM. The UK mechanism applies to specified products and calculates liability according to their embedded emissions. But the numbers show the scale of industrial trade that could be affected. The issue is what happens when other markets follow the same path.
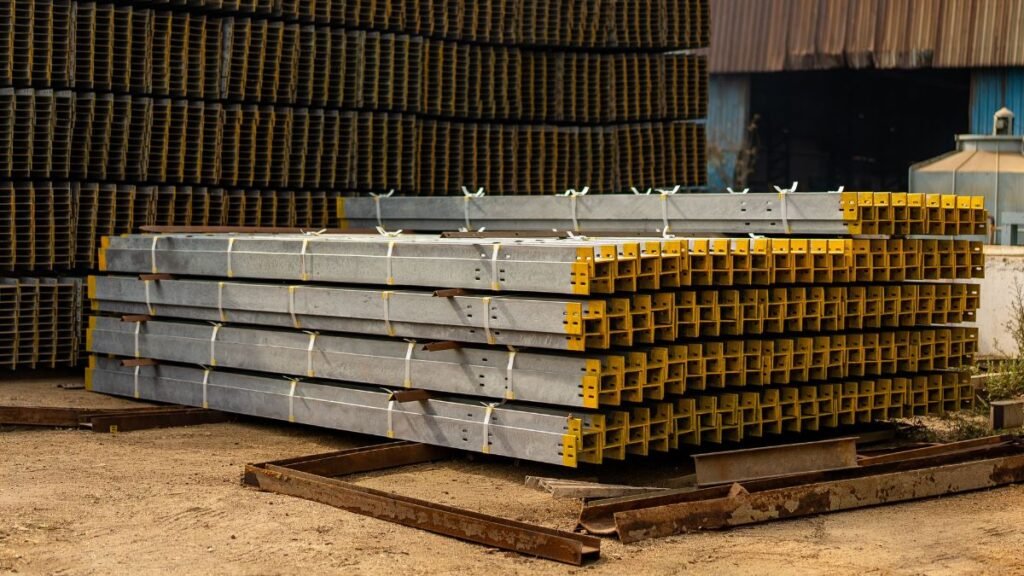
India is not Alone
The UK’s qualifying list contains 16 overseas carbon-pricing systems, including those of the EU, China, Japan, South Korea, Australia, Canada, New Zealand, Singapore and South Africa, alongside India. This is where the global picture gets interesting.
The European Union already operates the world’s best-known carbon border mechanism. China has a national emissions trading system. South Korea has had an emissions trading system since 2015. Japan introduced its national GX emissions trading system in 2026. But these systems do not all put the same price on carbon.
The World Bank’s 2026 Carbon Pricing Dashboard puts the main EU ETS price at about $70 per tonne of CO₂ equivalent. South Korea’s ETS is around $10, while Japan’s carbon tax is around $2. India’s compliance mechanism is still being developed, so the World Bank does not yet assign it a comparable compliance carbon price.
The numbers should not be read as a league table. Carbon-pricing systems cover different sectors, use different rules and offer different levels of free allocation or compensation. But they reveal something important: there is no single global carbon price. There is, however, an increasingly global expectation that carbon should have a price.
Changes the Calculation for Indian Industry
For an Indian steel or aluminium producer, emissions are no longer only an environmental metric. They can become an export cost. That creates an incentive to reduce energy use, switch to cleaner power, improve production efficiency and measure emissions more accurately. India’s CCTS is therefore becoming relevant to trade policy as much as climate policy. But there is a catch.
A carbon market only helps exporters if the system behind it can produce reliable, verifiable data. Indian engineering exporters have already warned that smaller companies could struggle with carbon certification requirements in overseas markets, particularly because verification can be expensive and technically demanding. For a large steel producer, measuring emissions may be an administrative challenge. For a small manufacturer supplying components to an exporter, it can become a cost that determines whether it can remain in the supply chain.
Who Pays — and Who Benefits?
The immediate beneficiaries of the UK’s recognition are likely to be exporters whose goods qualify for carbon-price relief. The wider benefits are less direct.
If Indian manufacturers remain competitive in overseas markets, that can support production, logistics and jobs. If carbon rules push companies to invest in cleaner technologies, new markets can emerge around emissions measurement, verification, energy efficiency and low-carbon manufacturing. But there is no basis yet to say that households will see lower electricity bills or cheaper products because of this decision. For most people, the connection is likely to be through employment and the wider economy rather than prices.
The Real Race is only Beginning
India’s recognition by the UK is useful, but it is not the finish line. The countries now competing for industrial investment and export markets are also building their own carbon-pricing systems. Some have been doing so for years; others are only beginning.
The question for India is whether its carbon market can move quickly enough from a regulatory framework to a functioning economic system — one that gives companies a reason to cut emissions while ensuring that cleaner Indian products remain competitive abroad. Because the next phase of global trade may not ask only how much a product costs. It may also ask how much carbon it costs to make it.
Society
Six Months of the Hormuz Crisis: A USD 330 Billion Global Fuel Bill — and India’s USD 22.5 Billion Share

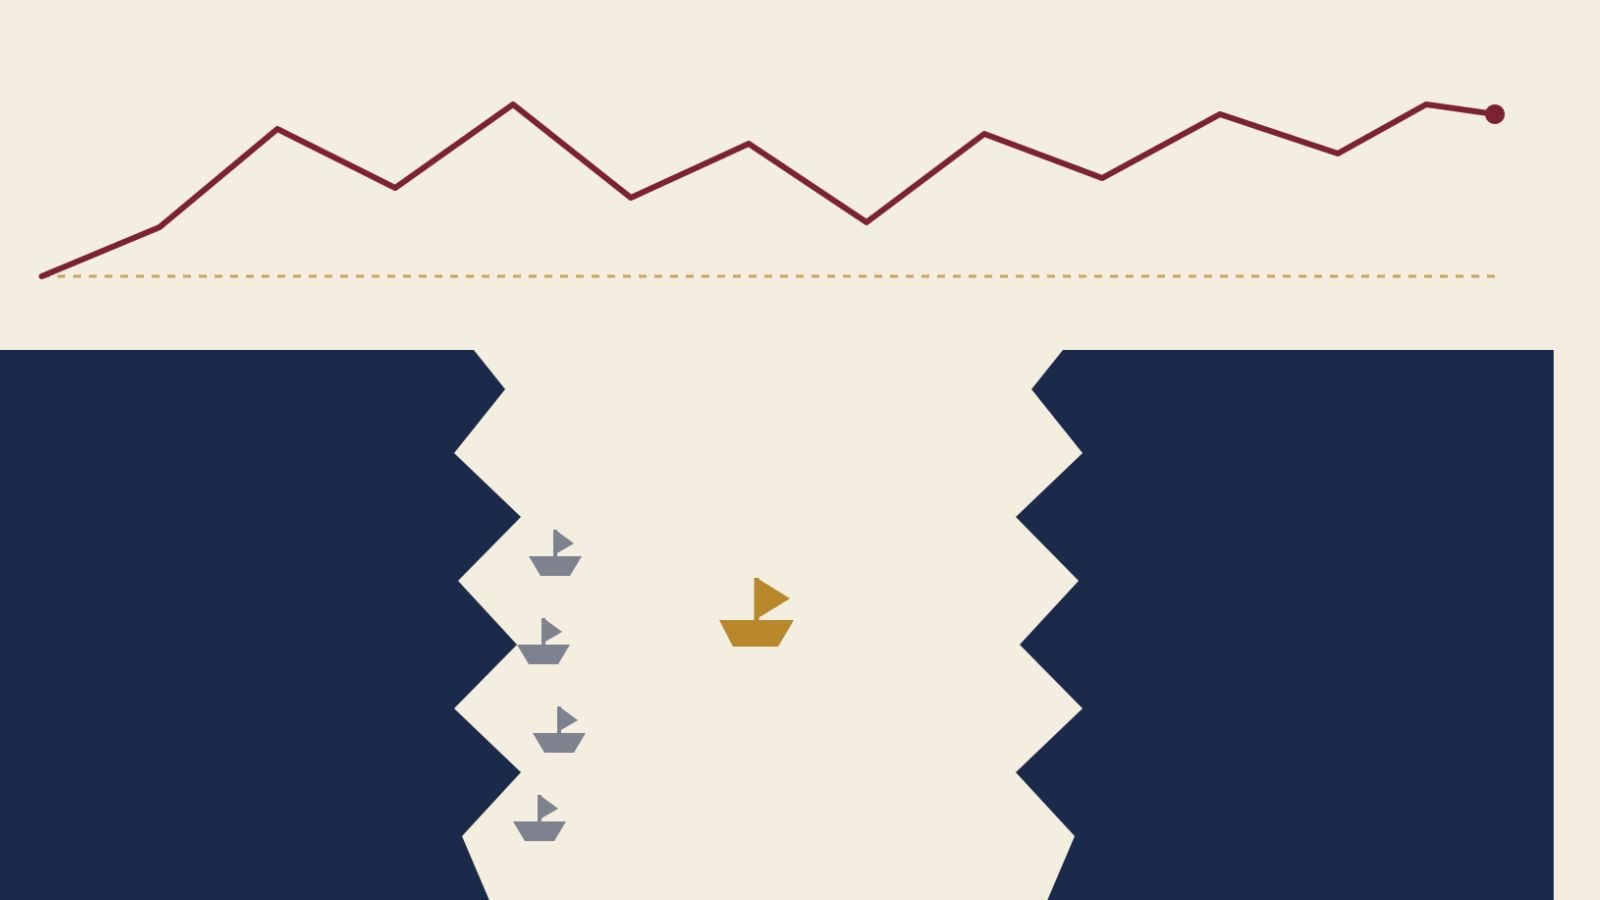
Six months into the Hormuz crisis, global fossil fuel importers have paid USD 330 billion above expected prices, with India’s additional bill reaching USD 22.5 billion.
EdPublica Data Desk | Analysis
Since the United States and Israel struck Iran on 28 February 2026 and shipping through the Strait of Hormuz collapsed, countries that import oil and gas by sea have paid more than USD 330 billion above what markets had expected to charge them, according to new research published by the Centre for Research on Energy and Clean Air (CREA). That works out to roughly USD 55 billion extra every month for half a year — the largest sustained fossil fuel price shock since the 1990 Gulf War, and one that is still running.
Hormuz crisis drives global fuel costs higher
India’s share of that bill is USD 22.5 billion, the second-highest of any country in the world, behind only China’s USD 35.5 billion and ahead of the United States, despite America being the world’s largest oil producer. That ranking is a direct consequence of how much of its energy India buys from abroad: the country imports close to 90 percent of the crude oil it uses, more than almost any other major economy, which leaves it with limited room to absorb a shock at the source.
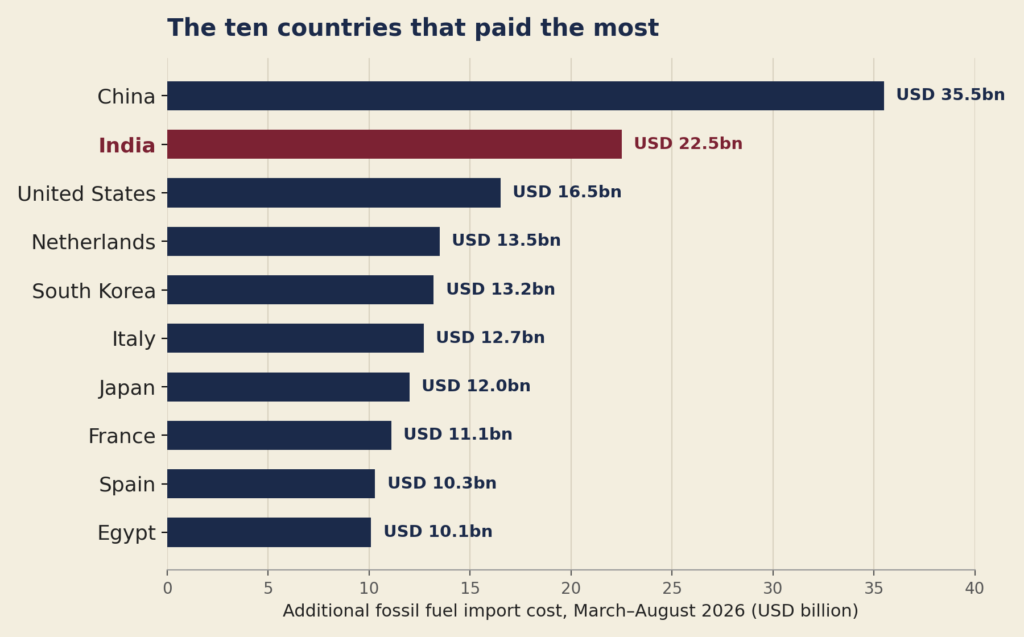
India paid the second-highest fossil fuel import premium of any country over the six months to August 2026, behind only China. Source: CREA analysis. Illustration: EdPublica
A shock rivalled only by the 1990 Gulf War
CREA’s estimate is built from actual, ship-tracked cargo data — sourced from Kpler — for crude oil, refined fuels and gas that moved by sea between March and August 2026, compared against the futures prices the market had already set for those same delivery months in the twelve days before the strikes. Because both sides of the comparison are settlements of the same contract, the gap is a direct, like-for-like price difference rather than a modelled estimate. The analysis covers 170 countries and deliberately excludes pipeline gas, coal, fuel oil, naphtha, freight and war-risk insurance, all of which would push the true cost higher. CREA describes its USD 330 billion figure as conservative on that basis.
Brent crude’s trajectory over the six months traced a path familiar from past oil shocks: a sharp spike in the first weeks, a partial retreat, and a second surge later on. Prices briefly touched pre-war levels in late June before climbing back above USD 100 a barrel in late July, a pattern CREA’s researchers compared directly against the 1990 Gulf War, the 2019 Abqaiq attack and the 2022 Russian invasion of Ukraine. Of those four episodes, only the Gulf War produced a larger and longer-lasting price premium than the current crisis.
Refined fuels rose faster than crude itself
Crude oil accounts for the largest single share of the extra cost, USD 164 billion, at an average premium of 35 percent over pre-war expectations. But the fuels people and businesses actually use day to day rose by a steeper proportion still. Diesel and gasoil were up 59 percent, adding USD 74 billion; gasoline rose 43 percent, adding USD 36 billion; jet fuel rose 59 percent, adding USD 20 billion; and LNG rose 60 percent in the Atlantic basin and 75 percent in the Pacific, adding USD 38 billion.
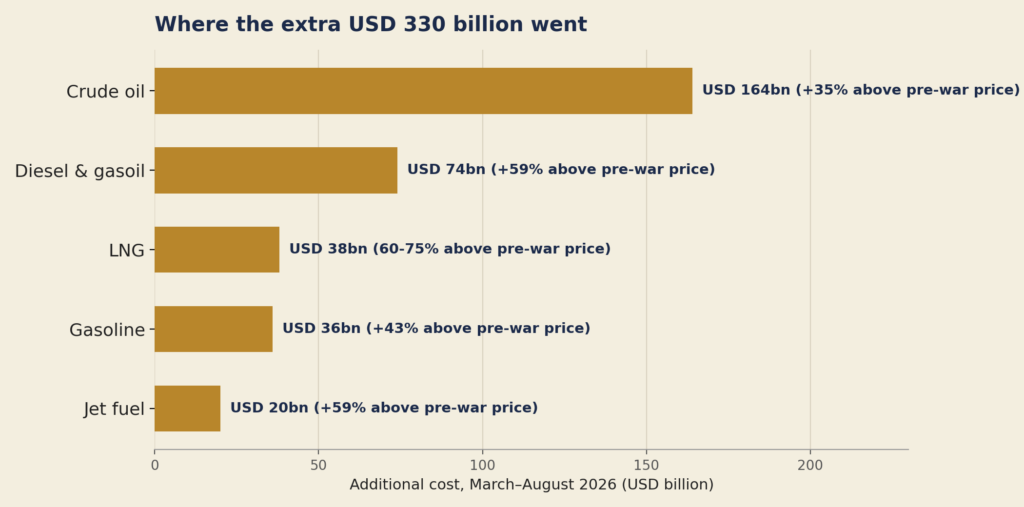
Refined fuels — diesel and gasoil in particular — rose by a steeper margin than crude oil itself. Source: CREA analysis. Illustration: EdPublica
Diesel’s premium mattered more than any other single figure in the analysis, because of how widely it is used. Industry, freight and farming all run substantially on diesel, so its price feeds directly into the cost of nearly everything else. Of the 170 countries CREA analysed, 134 paid more for diesel than their pre-war futures had implied. The war premium for diesel stayed above 55 percent in five of the six months, dipping to 43 percent in June before climbing back to 65 percent by August. Even the United States, the world’s largest oil producer, was not insulated: the average price of a gallon of diesel rose to USD 5.57 in the week of 17 August, the highest level since 2022 and closing in on that year’s record, according to AAA.
The clean energy dividend
The research’s central finding on mitigation is that a country’s exposure to the shock has been shaped less by geography than by how much of its power already comes from clean sources. Clean power capacity added since 2020 saved importing countries an estimated USD 36 billion in avoided coal, gas and oil imports in the first five months of the crisis alone. Of that, USD 10.6 billion existed only because of the war itself: every unit of coal or gas a country did not need to buy was a unit it did not have to purchase at inflated wartime prices, on top of whatever it would ordinarily have saved.
| “The best way to protect against high oil prices is to get off the black stuff as quickly as possible. Oil and gas prices have long proven to be an Achilles’ heel for both household finances and the global economy as a whole.” — Luke Wickenden, Energy Analyst, CREA |
“The energy transition is an investment,” Wickenden added, “so the best day to have started is yesterday.” Electrification is compounding the effect: the world’s electric vehicle fleet is on course to displace around five million barrels of oil a day by 2030, roughly comparable to the volume of crude Saudi Arabia currently moves through its East-West Yanbu pipeline specifically to bypass the Strait of Hormuz, according to the International Energy Agency’s Global EV Outlook.
Poorer countries are absorbing a bigger hit
The burden of the crisis has fallen unevenly by income, not just by geography. Low- and lower-middle-income countries paid an additional 1.0 percent of their 2024 GDP in higher fossil fuel costs, more than twice the 0.45 percent burden faced by high-income countries.
| “Across every fossil fuel product, this crisis is a multi-car pile-up, and where you land depends on what you’re driving. Wealthier nations, for whom paying extra is less of a burden in the short term, can absorb the higher prices. That’s not the case for lower-income countries that are far more price-sensitive. The countries best placed are the ones already in the EV lane: with fuel imports slashed, they can skirt the pile-up altogether.” — Luke Wickenden, Energy Analyst, CREA |
India’s particular exposure
India’s position in the top three is not simply a function of the size of its economy. The country entered 2026 already navigating a difficult trade-off on energy: after Washington imposed additional tariffs on Indian exports over New Delhi’s imports of discounted Russian crude, India had been cutting back on Russian oil and increasing purchases from the Middle East in pursuit of a US trade deal. The Hormuz crisis disrupted that shift almost immediately, cutting off much of the Middle Eastern supply India had been leaning on and pushing it back toward Russian crude even as prices climbed and a separate US sanctions waiver on Russian oil purchases lapsed in April.
By June, India’s total crude imports had hit a monthly record of roughly five million barrels a day, with Russian supplies alone reaching an unprecedented 2.6 million barrels a day — 54 percent of the country’s total crude imports, and more than double the volume seen in February. That pivot briefly inverted the usual arithmetic: discounted Urals crude, which had traded well below Brent since 2022, began trading at a premium to it in March, as Indian and Chinese refiners competed for the limited Russian cargoes still reaching them outside the Gulf. By July, as Gulf supply chains began to normalise, Urals discounts had reopened to more than USD 10 a barrel below Brent.
Russian crude functioned, in effect, as India’s insurance policy against a disruption its strategic reserves were not large enough to absorb on their own — but insurance still has a premium, and India’s USD 22.5 billion bill is a measure of how much of that premium it ultimately paid, on top of what it saved through the Russian discount.


IEA’s New Report on What Would a Net-Zero Compatible Electricity System Require

As Indian Cities Change, What Happens to the House Sparrow?

JWST Finds Water Around a Dying Star Near the Milky Way’s Black Hole

How India’s River Dolphins Navigate a Changing River System

From Scams to Screens: How the National Stock Exchange Rewrote India’s Equity Story
From Scams to Screens: How the National Stock Exchange Rewrote India’s Equity Story

Farmers Borrowed to Build ‘Diggis’. Two Years Later, They Are Still Waiting for the Subsidy

When the Himalayas Collapse Without Warning, What Counts as Preparedness?

Aim for the Stars: Anjali Thomas’s Journey from a Small College in Kerala to the Frontiers of Medical Imaging

Anxiety Freezes Career Decisions. Curiosity Unfreezes Them

-

 Math2 months ago
The 2026 Fields Medals: Four Proofs, Four Decades-Old Problems Solved
-
Climate2 months ago
After Kerala’s Deadliest Landslide, the Hardest Thing to Rebuild Was Childhood
-
Society3 months ago
West Asia Crisis: Can Kerala’s Returning Gulf Migrants Find a Future in the Green Economy?
-
Space & Physics4 months ago
India Semiconductor Mission: ‘It’s Not About Fabs. It’s About Building An Entire Ecosystem’
-
Climate4 months ago
The Climate World Cup? How Climate Change Could Affect Player Performance at the 2026 World Cup
-
Society2 months ago
What Is Civilisational Diplomacy? Understanding India’s Newest Foreign Policy Tool
-
Society3 months ago
From Bell Labs to the Classroom: A Second Career in Teaching
-
Space & Physics4 months ago
Engineers Develop Dual-Mode Propulsion System for Next-Generation Small Satellites