
Climate & Environment
Europe’s 2026 Heatwaves Linked to More Than 32,000 Deaths, Study Estimates
Heat-related deaths in 854 European cities reached an estimated 50,391 in summer 2026, according to a new study. Malta, Italy and Hungary recorded the highest modelled mortality rates, while a severe June heatwave accounted for nearly one-third of the estimated toll.


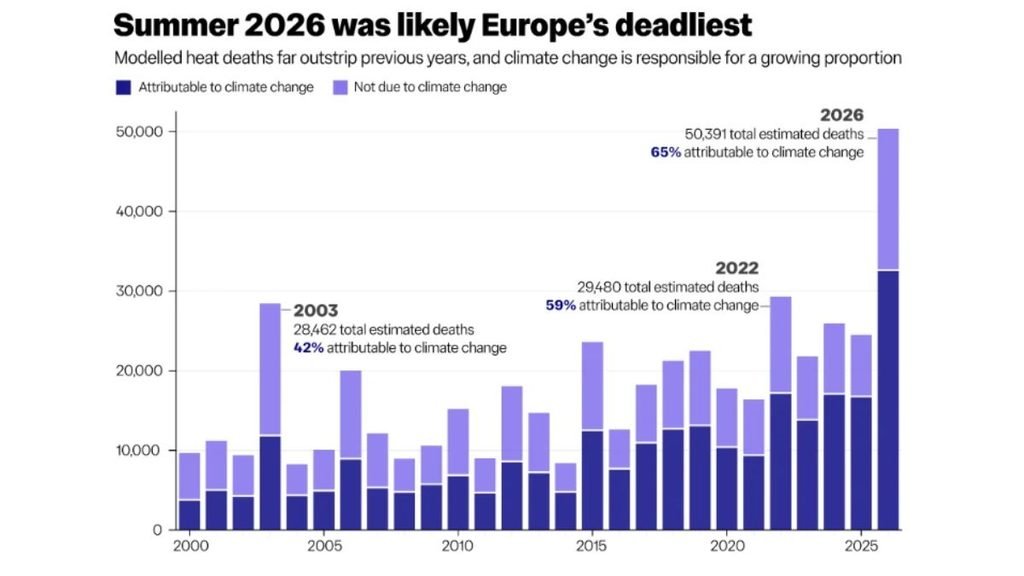
Europe’s summer heat took an estimated 50,391 lives across 854 cities in 2026, with human-induced climate change contributing to nearly two-thirds of the heat-related deaths, according to a new study. The researchers estimate that 32,619 deaths—65% of the total—would not have occurred in the same way without the additional warming caused by human activities.
The findings point to a particularly heavy toll in southern Europe, where heat-related mortality rates were substantially higher than in the continent’s northern regions. Malta recorded the highest modelled rate, at 716 deaths per million people, followed by Italy at 561, Hungary at 537 and Croatia at 461.
The estimates cover June to August and are based on 854 cities across 30 countries, including the 27 European Union member states, the United Kingdom, Norway and Switzerland. These cities had a combined population of about 173 million in 2026, representing nearly 40% of the population across the countries studied. The figures therefore describe the burden in the cities covered by the research, rather than a complete count for Europe.
The scale of the estimated toll is striking against the backdrop of another exceptionally hot European summer. The Copernicus Climate Change Service ranked summer 2026 as the continent’s third warmest on record and the warmest on record in western Europe. The region’s seasonal mean temperature reached 21.69°C, which was 2.54°C above the 1991–2020 average.
Southern Europe Bears the Heaviest Mortality Burden
The study’s age-standardised estimates show a marked regional divide. Southern Europe recorded 380 heat-related excess deaths per million people, compared with 277 in western Europe, 250 in eastern Europe and 129 in northern Europe.
These rates account for differences in population age structure, making regional comparisons more meaningful. They also show why the number of deaths attributed to warming and the overall mortality rate should not be treated as interchangeable measures.
The proportion of heat-related deaths attributed to human-induced climate change was highest in Estonia and Bulgaria, at 81% in each, followed by Finland at 80%. Southern Europe’s estimated share was 69%, while northern Europe’s was 59%.
A high climate-attributable proportion does not necessarily mean a country had the highest heat mortality rate. The two measures answer different questions: how much heat-related mortality occurred, and how much of that burden can be attributed to human-caused warming. The researchers also caution that Malta’s estimate of the climate-attributable share carries considerable uncertainty.
Summer Heat: Deadly Fortnight in June
Nearly one-third of the estimated summer deaths occurred between June 17 and July 1, when the average daily mean temperature across the cities was 5.3°C above the 1991–2020 average. The study estimates that 57% of heat-related deaths during this period were attributable to human-induced climate change.
That share was lower than the 65% estimate for the summer as a whole. It does not mean climate change had little influence on the June heatwave. The researchers explain that the episode was so extreme that it would still have caused substantial harm even in a hypothetical climate without human-caused warming.
“I think we can be quite confident in stating that the summer of 2026 is likely to have been
the worst on record for heat-related mortality across much of Europe. These numbers are a
stark reminder that our hotter, more extreme summers are having an increasingly severe
impact on public health. Behind these statistics are real people whose lives were lost and
real families who grieve for them.
“It is yet another reminder both of the imperative of rolling out targeted interventions to protect those who are most vulnerable to this increasingly extreme heat, and of the growing need to rapidly transition away from fossil fuels to slow the pace of change and limit future warming.” said, Dr Clair Barnes, Extreme Weather and Climate Change Researcher at the Centre for Environmental Policy, Imperial College London
The city-wide average also conceals local extremes. The study found that the average daily temperature anomaly across the cities peaked at 7.3°C above normal, while some countries experienced days with temperatures as much as 12°C above their usual levels. Western Europe recorded an average summer temperature anomaly of 2.9°C, and southern Europe 2.6°C. The analysis also estimated 1,508 additional heat-related deaths between May 21 and May 31. These are reported separately from the headline June–August total.
Older People Face the Greatest Risk
Age was a major factor in the estimated mortality burden. People aged 85 and older accounted for 22,502 heat-related excess deaths—close to 45% of the summer total. By comparison, the estimated number among people aged 20 to 44 was about 833.
The toll was not confined to older adults. The study estimates that around 6,000 heat-related excess deaths occurred among people under 65, underscoring the risk faced by working-age adults as well as older residents.
Heat exposure can become especially dangerous when high daytime temperatures persist into the night, leaving the body with less opportunity to recover. The researchers note that the June episode involved high humidity and unusually warm nights, conditions that may have contributed to the health burden and could mean the model underestimated its effects.
The figures are statistical estimates of excess mortality, not a tally of death certificates naming heat or climate change as the cause. The researchers modelled the relationship between temperature and mortality, then estimated how many deaths were associated with observed temperatures and how that burden changed when the human-caused component of warming was removed.
Toll Higher Than Previous Benchmark Summers
Using the same group of 854 cities and the same analytical framework, the researchers estimated 29,480 heat-related excess deaths in summer 2022, 28,462 in 2003 and 24,572 in 2025. The 2026 estimate of 50,391 is substantially higher than each of those figures.
The comparison matters because estimates produced using different methods, time periods or geographical coverage can give misleading impressions of how mortality has changed. Applying a consistent framework to the same cities provides a more direct comparison, although the figures remain modelled estimates. National monitoring systems have also reported large mortality burdens during the 2026 heat episodes, but their estimates cannot be directly added to or compared with the study’s total.
In France, the national public health agency estimated at least 5,764 excess deaths from all causes during the June 17–July 2 heatwave across 92 departments covering 98.5% of mainland France’s population. Around two-thirds of those deaths were among people aged 75 and older. The measure captures excess deaths during the heatwave; it does not mean every death was individually certified as heat-related.
In England, the UK Health Security Agency estimated 2,124 heat-associated deaths during the June 21–28 heatwave and another 753 during a May episode, giving an interim combined estimate of 2,877. Germany’s Robert Koch Institute estimated around 16,000 heat-related excess deaths over a longer period, from April 6 to September 6, while Spain’s mortality monitoring system reported 5,123 excess deaths for June to August. Differences in coverage, time periods and methods mean these national figures should be read in their own context.
What the Estimates Can/Cannot Tell
To estimate the effect of climate change, the researchers compared observed temperatures with a counterfactual scenario in which the human-caused component of warming was removed. They then applied age-specific relationships between temperature and mortality, drawing on mortality data from 232 European Union cities covering 2000–2019, alongside population and mortality estimates for 2026.
The approach allows researchers to estimate the contribution of human-induced warming across many cities, but it has limitations. The underlying exposure–response data may not fully reflect changes in healthcare, adaptation, health conditions or vulnerability since 2019. The model also uses daily mean temperatures and assumes vulnerability remains constant throughout the year.
The study’s findings are therefore not a direct count of deaths that can individually be assigned to climate change. They are an estimate of how much the summer’s heat-related mortality burden changed because of human-caused warming.
Even with those qualifications, the size of the estimated toll raises practical questions for cities facing increasingly severe heat. Early warnings, accessible cooling spaces, support for older people and others at higher risk, and health services prepared for heat-related illness can help reduce exposure and its consequences. Cutting greenhouse gas emissions remains essential to limiting further warming, while public-health measures can help protect people from the heat already occurring.











Climate & Environment
MIT Develops AI Technique to Make Climate Predictions Faster and More Reliable
MIT scientists have developed a training technique that could make AI climate emulators faster to build, more adaptable and better at predicting unfamiliar emissions scenarios.
Climate & Environment
Global Climate Finance Hits Record $1.9 Trillion, but Vulnerable Nations Continue to Face Adaptation Funding Gap
Global climate finance reached a record $1.9 trillion in 2023–2024, but vulnerable developing countries continue to face an adaptation funding gap. As COP31 begins, questions remain over the delivery of the new $300 billion annual climate-finance target and equitable access to funding.

Global climate finance reached an unprecedented annual average of $1.9 trillion in 2023–2024, increasing by 32 per cent compared with the previous two-year period. However, despite the growth in investment, developing countries continue to face significant barriers in accessing the resources needed to adapt to climate change, according to assessments by the United Nations Framework Convention on Climate Change (UNFCCC) and the Organisation for Economic Co-operation and Development (OECD).
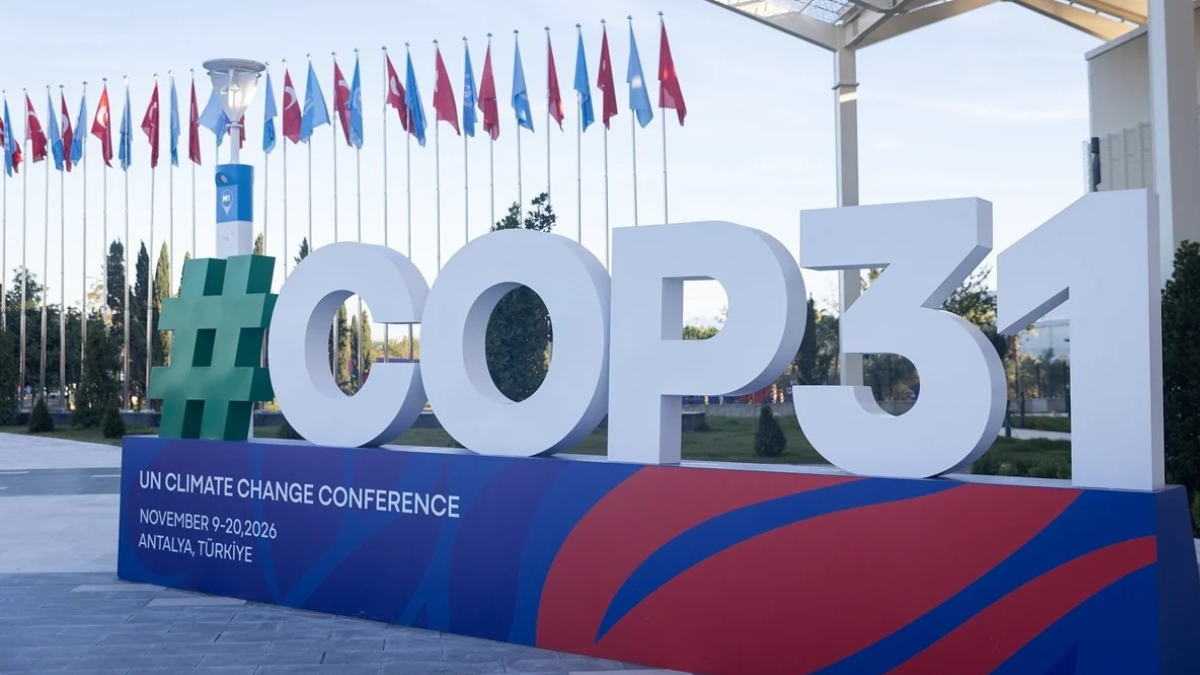
The findings come as countries meet for the 31st United Nations Climate Change Conference (COP31) in Antalya, Türkiye, from November 9 to 20. The conference takes place during the transition from the previous $100 billion annual climate-finance commitment to a new target of $300 billion by 2035.
Developed countries exceed $100 billion target, but questions remain
Developed countries had pledged to mobilise $100 billion annually by 2020 to support climate action in developing countries. The commitment was subsequently extended through 2025. According to the OECD’s 2026 assessment, developed countries provided and mobilised $132.8 billion in 2023 and $136.7 billion in 2024, exceeding the target for the third consecutive year.
However, the reported totals do not necessarily represent grants or money directly disbursed to developing countries. They include different forms of public finance, multilateral development bank contributions and private finance mobilised through public interventions.
Differences in accounting methods have also complicated assessments of whether countries are meeting their commitments. The UNFCCC’s 2026 assessment highlights variations in how countries report loans, grants, commitments and disbursements, making comparisons between datasets difficult.
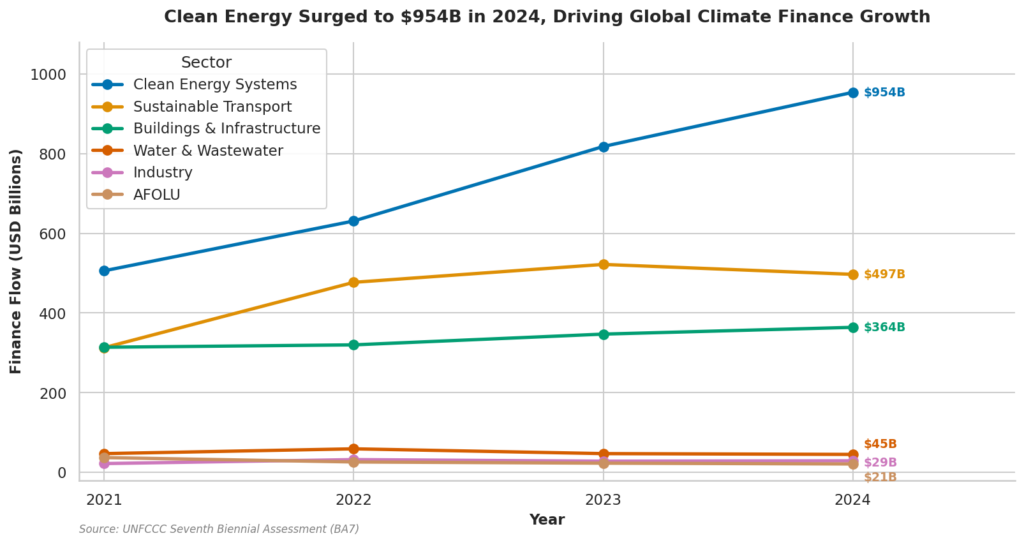
Total global climate finance reached an annual average of USD 1.9 trillion in 2023–2024.
The earlier target is now being replaced by the New Collective Quantified Goal (NCQG), adopted at COP29 in 2024. It calls for developed countries to take the lead in mobilising at least $300 billion annually for developing countries by 2035. The wider ambition is to scale up climate finance from all sources to at least $1.3 trillion annually by the same year.
Adaptation remains dependent on public finance
The expansion of climate finance has not translated into comparable support for adaptation. Investments in mitigation, including renewable energy and low-emission transport, have attracted substantial private capital. Adaptation projects such as flood protection, resilient agriculture, water management and coastal infrastructure, however, often generate fewer direct commercial returns.
The OECD reported that developed countries’ adaptation finance reached $33.6 billion in 2023 and $34.7 billion in 2024. Public finance accounted for more than 90 per cent of the tracked adaptation finance in both years, highlighting the continued dependence of adaptation initiatives on government and multilateral funding.
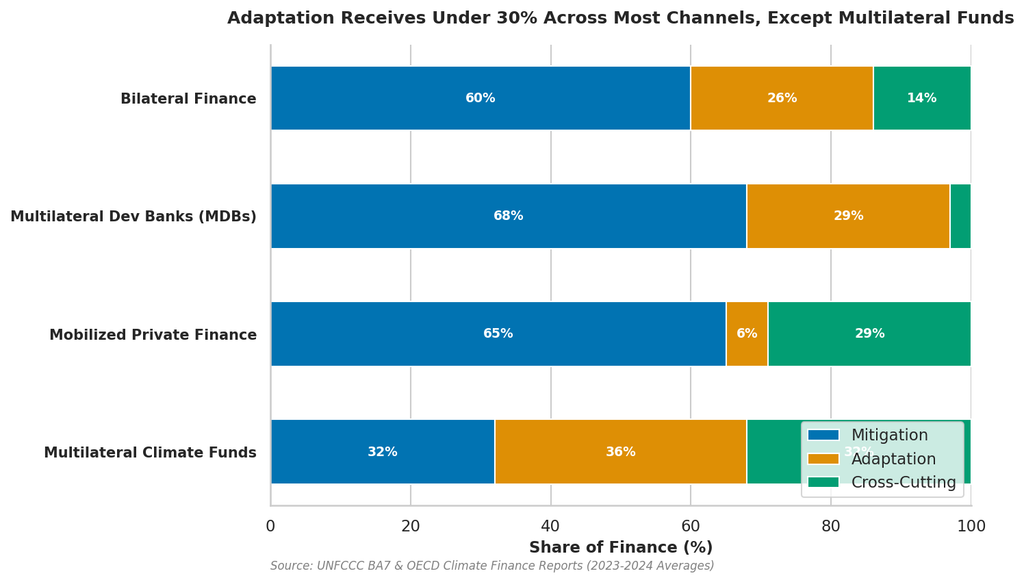
The broader financing gap is considerably larger. The United Nations Environment Programme’s Adaptation Gap Report 2026 estimates that developing countries will require approximately $305 billion annually by 2035 to meet their adaptation needs. This is substantially higher than the current international public adaptation finance flows.
LDCs and island nations receive a limited share
The financing imbalance is particularly significant for Least Developed Countries (LDCs) and Small Island Developing States (SIDS), which face high exposure to extreme weather, rising sea levels and other climate-related risks.
According to the OECD, LDCs received an annual average of $24.5 billion in climate finance in 2023–2024. SIDS received $3.8 billion in each of those years. The figures underline the limited scale of financial support reaching countries with substantial adaptation requirements.
A report published by the United Nations Capital Development Fund ahead of COP31 found that LDCs, which are home to almost 20 per cent of the global population, received only 1.9 per cent of global climate finance in 2024.
The terms on which finance is provided are also important. The UNFCCC’s assessment found that loans accounted for 91 per cent of multilateral development bank climate finance in its 2023–2024 channel-level breakdown. While loans can support large infrastructure projects, debt-based finance may place additional pressure on countries already facing economic constraints.
COP31 must move from targets to delivery
The latest figures reveal a gap between the scale of global climate investment and the resources reaching countries most vulnerable to climate impacts. Although the new $300 billion target represents an increase in the international climate-finance commitment, its effectiveness will depend on how much funding is accessible, predictable and directed towards adaptation.
For developing countries, particularly LDCs and SIDS, increasing the grant component, improving transparency in financial reporting and expanding concessional funding will be essential.
COP31 offers an opportunity to address these concerns as countries begin implementing the new climate-finance framework. The challenge is no longer only to mobilise larger sums, but to ensure that finance reaches communities facing the greatest climate risks.
Climate & Environment
India Ranks 28th in Global Climate Ranking, Down Five Places
India has dropped five places to 28th in the Climate Change Performance Index 2027. Despite reaching 50% non-fossil installed power capacity, coal supplied 71% of its electricity in 2025.

India has reached a major milestone in renewable energy capacity, with non-fossil fuel sources accounting for half of its installed electricity capacity in June 2025. Yet coal continued to generate 71% of the country’s electricity that year. This gap between capacity additions and the actual electricity mix is central to India’s performance in the Climate Change Performance Index (CCPI) 2027, where the country has slipped five places to 28th.
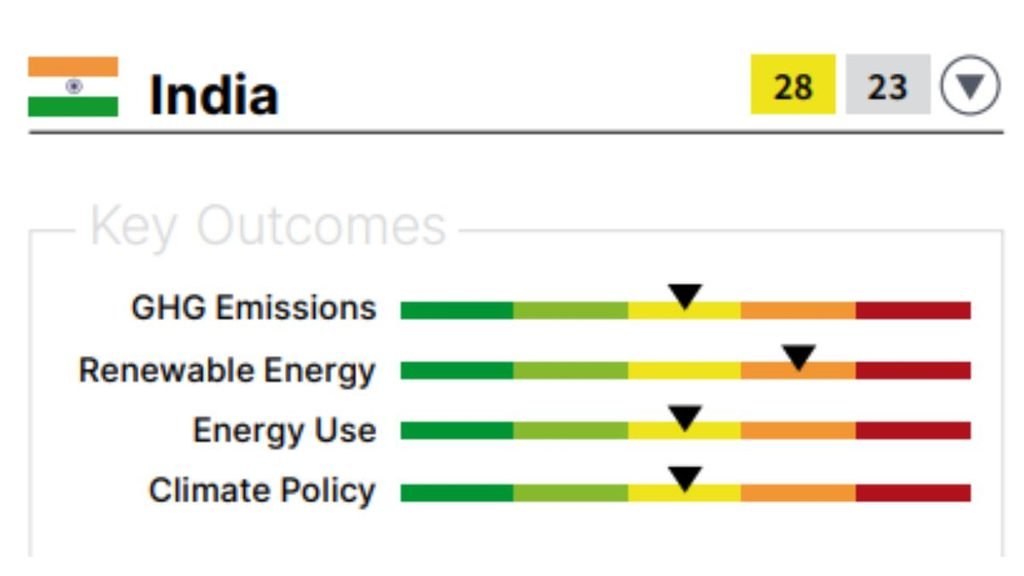
The index, published by Germanwatch and the NewClimate Institute, gives India an overall medium rating. Its assessment points to a mixed record: India has made substantial progress in expanding renewable energy and has performed relatively well on climate policy, but its energy use, emissions and renewable energy performance remain areas of concern.
India’s fall in the rankings should not be read as evidence that its renewable energy expansion has stalled. The country reached the 50% non-fossil capacity milestone five years ahead of its earlier 2030 target. However, installed capacity measures the potential to generate electricity, not how much power sources actually supply. The milestone also includes nuclear energy.
Data from Ember’s Global Electricity Review 2026 show that coal accounted for 71% of India’s electricity generation in 2025, against a global average of 33%. India’s coal generation did fall by 2.9% that year, while renewable generation rose sharply. But the continued dominance of coal in the electricity mix shows how much of the country’s power demand remains tied to fossil fuels.
Grid Constraints Slow the Transition
The challenge is becoming visible in the way India’s electricity grid handles solar power. An Ember analysis published in January 2026 estimated that the country curtailed 2.3 terawatt hours (TWh) of solar generation between late May and December 2025. Grid operators had to reduce solar output as an emergency measure to maintain grid security.
The problem is linked partly to the limited flexibility of conventional power plants. Solar generation rises during daylight hours, while electricity demand continues into the evening, when solar output falls. Coal-fired plants that remain online to meet demand can have limited room to reduce their output further. Without sufficient storage and other flexible sources of electricity, the grid cannot always accommodate the full amount of renewable power available.
This creates a practical constraint for India’s energy transition. Adding solar and wind capacity is essential, but the electricity system also needs stronger transmission networks, battery storage and power plants capable of adjusting output to changes in demand and renewable generation. Otherwise, more installed capacity will not translate into an equivalent reduction in coal-fired electricity.
The CCPI’s category rankings reflect the uneven progress. India ranks 13th in climate policy, but 31st in greenhouse gas emissions, 33rd in energy use and 40th in renewable energy. Its renewable energy category receives a low overall rating, despite a high trend indicator. This suggests that recent progress is significant, while the overall level of renewable energy deployment and its contribution to the energy system still have considerable room to improve.
India’s targets: Stronger Implementation
India’s updated climate commitments set out targets for 2035. These include reducing the emissions intensity of its gross domestic product by 47% from 2005 levels, raising the share of non-fossil sources to around 60% of cumulative installed electricity capacity, and creating a carbon sink of 3.5–4 billion tonnes of carbon dioxide equivalent through forest and tree cover.
The country has also begun implementing its Carbon Credit Trading Scheme, with emissions-intensity targets assigned to 490 industrial entities from January 2026. The effectiveness of the scheme will depend on the ambition of those targets, reliable monitoring and verification, and evidence that participating industries are actually reducing emissions.
The index also draws attention to gaps in energy efficiency. Building energy codes and appliance standards exist, but compliance remains uneven, particularly in informal markets. In transport, urban rail connectivity had expanded to 26 cities by August 2026. However, public transport improvements will also require affordable and reliable bus services, along with safer infrastructure for walking and cycling.
India’s dependence on imported fossil fuels adds an economic and energy-security dimension to the transition. Disruptions to shipping through the Strait of Hormuz have highlighted the risks faced by countries that rely on international supplies of oil and gas. Reducing fossil fuel consumption would help limit exposure to such external shocks, alongside its climate benefits.
Climate Change Performance Index: How India Compares With Other Major Economies
The CCPI leaves its first three positions vacant because no country meets the highest performance standards across all assessed categories. Denmark ranks highest at fourth place, followed by Lithuania and Luxembourg. Denmark has remained the best-performing country in the index for six consecutive years.
The contrast with the United Kingdom is also instructive. The UK, ranked seventh, is the only G20 economy to receive a high overall rating. Its electricity system became coal-free in 2025, according to Ember. Ten G20 members, meanwhile, received very low ratings in the CCPI, underscoring the difficulty major economies face in aligning their energy systems and climate commitments. India’s 28th position places it ahead of several developing economies, including Brazil at 21st, the Philippines at 16th and Nigeria at 17th. But its ranking also shows that early gains in clean-energy capacity do not, on their own, secure a stronger overall climate performance.
India has set a net-zero emissions target for 2070. The CCPI assessment points to the need for clearer, time-bound pathways for reducing the use of coal, oil and gas, with sector-specific milestones and plans to support workers and regions dependent on fossil fuel industries. The immediate test is visible in the electricity system: India must make its growing renewable capacity more usable, while reducing the share of power generated from coal. Until that happens, the country’s clean-energy expansion will continue to coexist with a power mix heavily dependent on fossil fuels.

Intellectual disabilities linked to severe educational disadvantage in India, study finds

Can Storytelling, Singing and Playing Help Children Reach Developmental Milestones? An Indian Study Explores the Link

TB deaths decline in India, but diagnostic gaps threaten elimination goals

Why NVIDIA Matters to the AI Revolution as Leadership Crisis Rocks the Chipmaker

MIT Develops AI Technique to Make Climate Predictions Faster and More Reliable

Indian universities lead Asia in research output per faculty, but the country’s top six all slip in QS ranking

Why Delhi’s Geography Makes It Vulnerable to Severe Air Pollution

Europe Braces for Extremes as Commission Unveils Climate Resilience Framework

NASA recruits new astronauts for future Moon Base and Mars missions

Between Lectures and Lyrics: Kabeer Is Building a Malayalam Hip-Hop Career One Self-Taught Skill at a Time
-

 Math4 months ago
The 2026 Fields Medals: Four Proofs, Four Decades-Old Problems Solved
-
EP Deep Dive: Data & Solutions4 months ago
After Kerala’s Deadliest Landslide, the Hardest Thing to Rebuild Was Childhood
-
EP Deep Dive: Data & Solutions4 months ago
West Asia Crisis: Can Kerala’s Returning Gulf Migrants Find a Future in the Green Economy?
-
Space & Physics6 months ago
India Semiconductor Mission: ‘It’s Not About Fabs. It’s About Building An Entire Ecosystem’
-
Interviews2 months ago
From Scams to Screens: How the National Stock Exchange Rewrote India’s Equity Story
-
Climate & Environment5 months ago
The Climate World Cup? How Climate Change Could Affect Player Performance at the 2026 World Cup
-
Society4 months ago
What Is Civilisational Diplomacy? Understanding India’s Newest Foreign Policy Tool
-
Society5 months ago
From Bell Labs to the Classroom: A Second Career in Teaching