
Climate
IEA Ministerial 2026: Global Energy Leaders Expand Ties, Push Critical Minerals Security
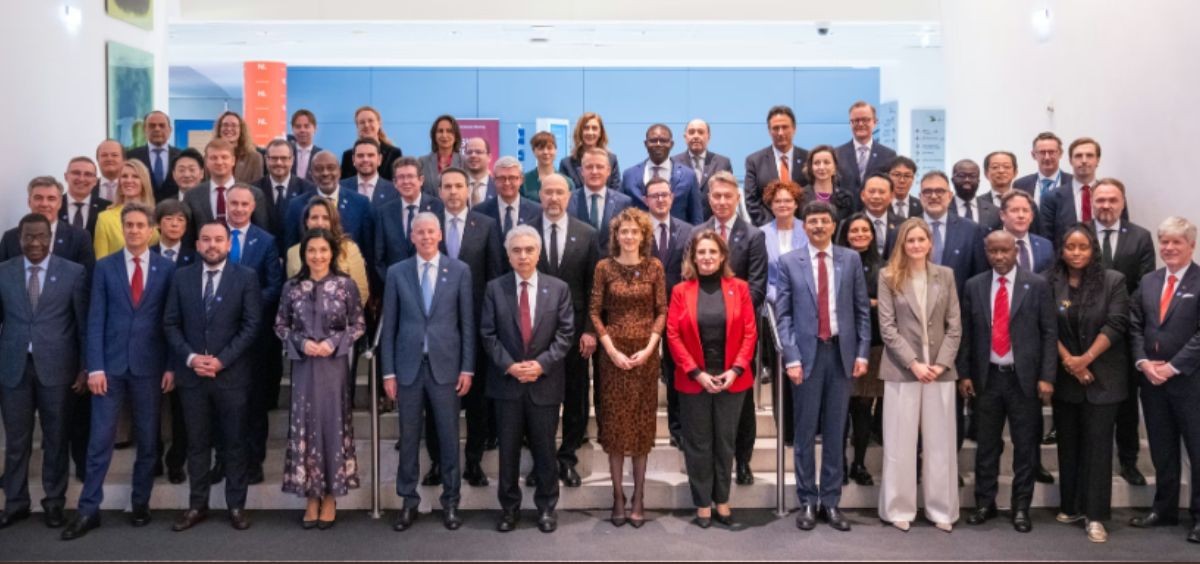
At the IEA Ministerial Meeting in Paris, 54 countries backed expanded membership talks with Brazil, India, Colombia and Viet Nam, while strengthening cooperation on critical minerals and clean energy security.











Society
Inside Gas Kitchens, Workers Face Heat as High as 50°C
Commercial kitchen air pollution can exceed health guidelines, with gas kitchens exposing workers to heat, nitrogen dioxide, benzene and carbon monoxide.


Climate
Climate Change, Overfishing and the Uncertain Future of Bangladesh’s Hilsa Fishermen
EDPUBLICA GROUND REPORT: Climate change, overfishing and pollution are putting Bangladesh’s Hilsa fishery under pressure, threatening catches and fishermen’s livelihoods.

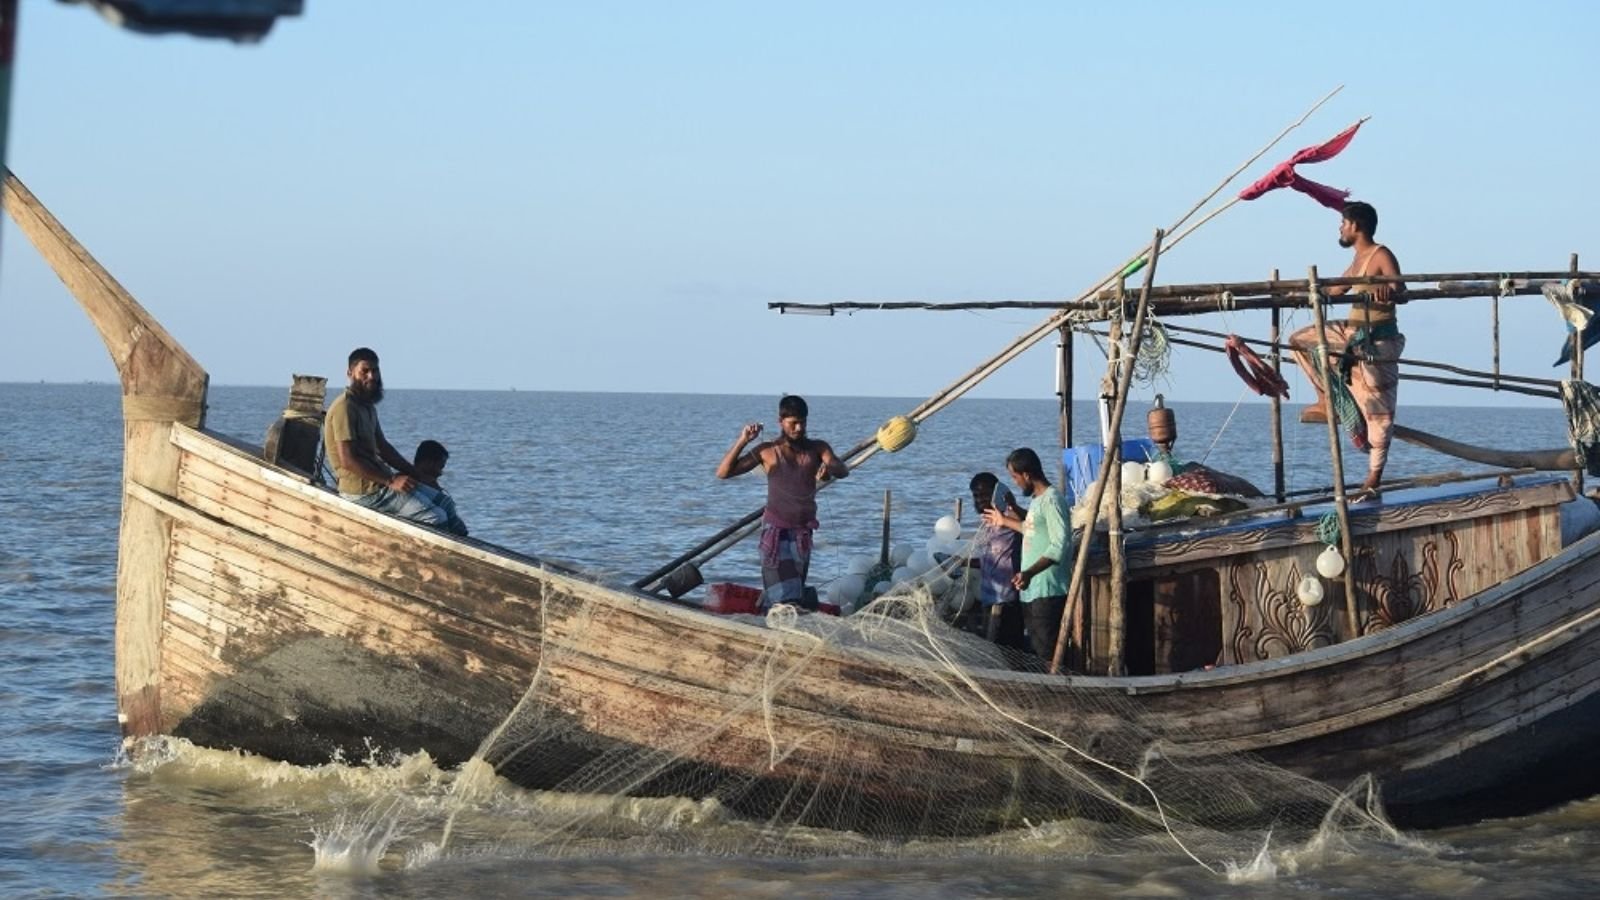
An EdPublica ground report from Bangladesh examines why the Hilsa catch has fallen after nearly two decades of growth, and what climate change and human pressures mean for the fishermen who depend on the fish.
DHALCHAR, Bhola, Bangladesh–At the fish landing centre, boats still come in one after another, and the crowd of fishermen on the shore grows with each arrival. But Ruhul Amin has stopped counting on what they carry.
“I can no longer support my family by catching Hilsa. I have been carrying the burden of debt for years. I wait for the Hilsa season every year with high hopes, but time and again, those hopes are dashed. There is no sign of Hilsa this year either, so I have to return home facing a loss.”
Ruhul Amin, 45, spoke these words amid the clamour of the fish landing centre on Dhalchar Island, situated along the banks of the Meghna River, one of the three principal rivers that form the vast Ganges Delta. Several other fishermen echoed his sentiments.
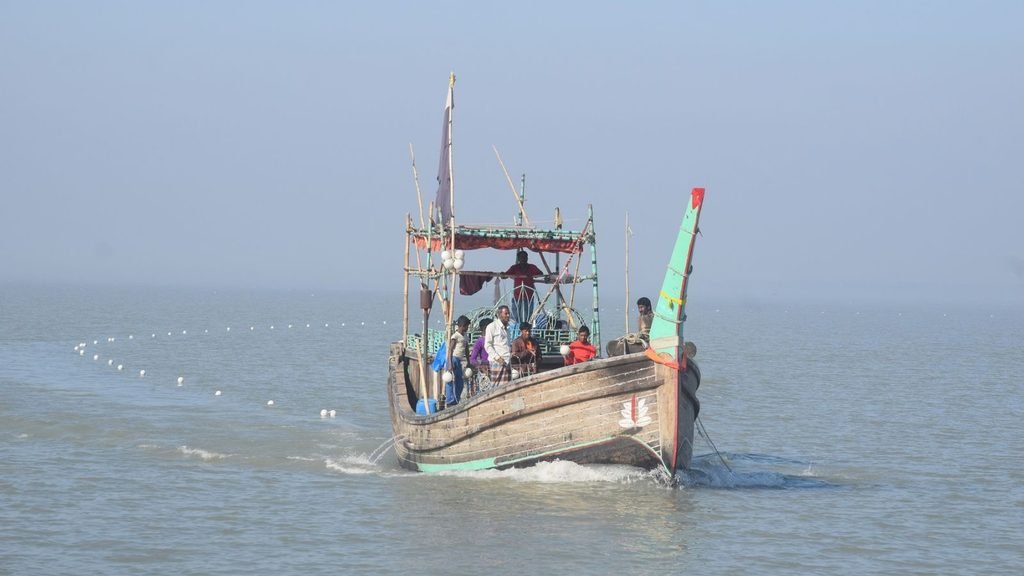
Dhalchar Island, located in the Meghna estuary, lies 100 kilometres from the Bhola district headquarters and 347 kilometres from the capital, Dhaka. Waves from the Meghna River crash against the island’s fish landing centre. The morning sun has just risen. Seagulls fly in flocks alongside the river waves. Boats dock one after another at the landing centre, and the crowd of fishermen grows. Yet, most of the boats arriving at the dock carry no Hilsa.
The area is bustling with activity—tea stalls, eateries, boat repair shops, and other establishments are crowded. However, there is a scarcity of the very fish—Hilsa—around which this landing centre was built. The fragile Dhalchar landing centre is shrinking due to river erosion, yet it remains a lifeline for the fishermen. Dhalchar Island remains quiet for most of the year but comes alive during the Hilsa season. Every year, thousands of fishermen gather here, filled with hope. It is not just Dhalchar Island; numerous fish landing centres along the coast of Bangladesh inspire similar hope among fishermen. About one million fishermen earn their livelihoods by catching Hilsa at these centres. Yet, they can no longer rely on Hilsa for their sustenance.
Ruhul Amin is one of those million fishermen. Amidst this despair and financial loss, the four-month-long Hilsa season is set to conclude on 7 October. The government has banned the catching, storing, transporting, and marketing of Hilsa for 22 days—from 8 October to 29 October—during the fish’s breeding season. Fishermen will once again have to wait until the following year for the Hilsa season.
“Fishing no longer sustains a livelihood”
Amidst the bustle and noise of the Dhalchar fish landing centre, Ruhul Amin voiced his frustration: “Every year, I’m forced to take out loans to go fishing with my boat and nets. I cast my nets during the Hilsa season with high hopes, but the catch is so meagre that it doesn’t even cover the operating costs. How am I supposed to repay the loans? How will I support my family? I may have to abandon this ancestral fishing profession; I can no longer bear the burden of debt.”
Bangladesh’s Hilsa Catch Is Falling After Two Decades of Growth
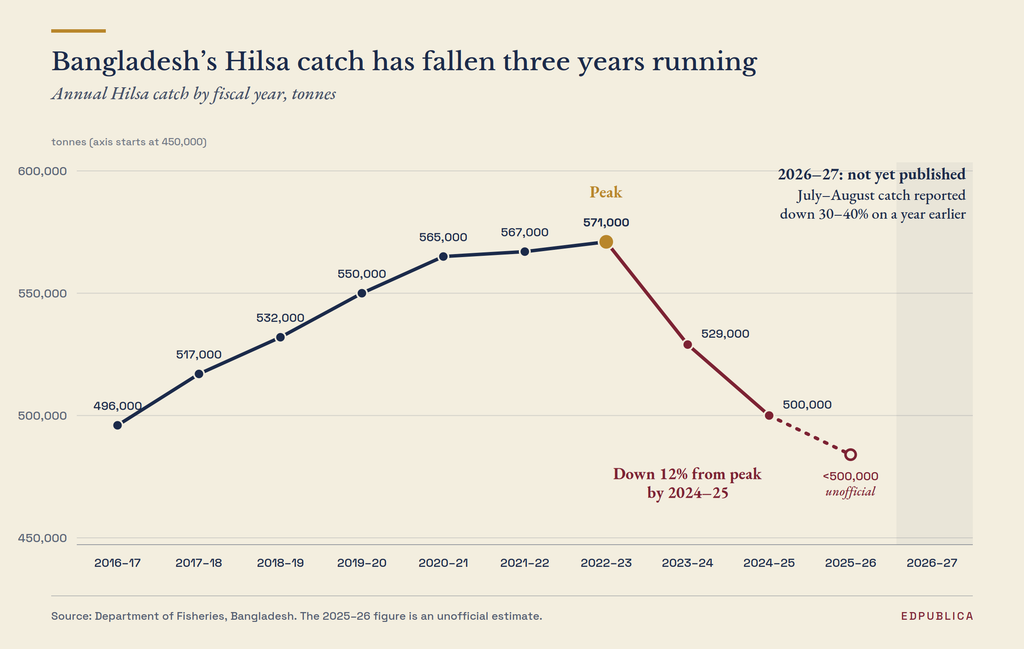
Even as the Hilsa season draws to a close, Ruhul Amin and many other fishermen have failed to recover their fishing expenses; they are ending the season at a loss. After nearly two decades of steady growth in Hilsa production in Bangladesh, the catch has fallen in each of the past three years. Simultaneously, the average weight of the fish is decreasing—a trend that has raised concerns among researchers.
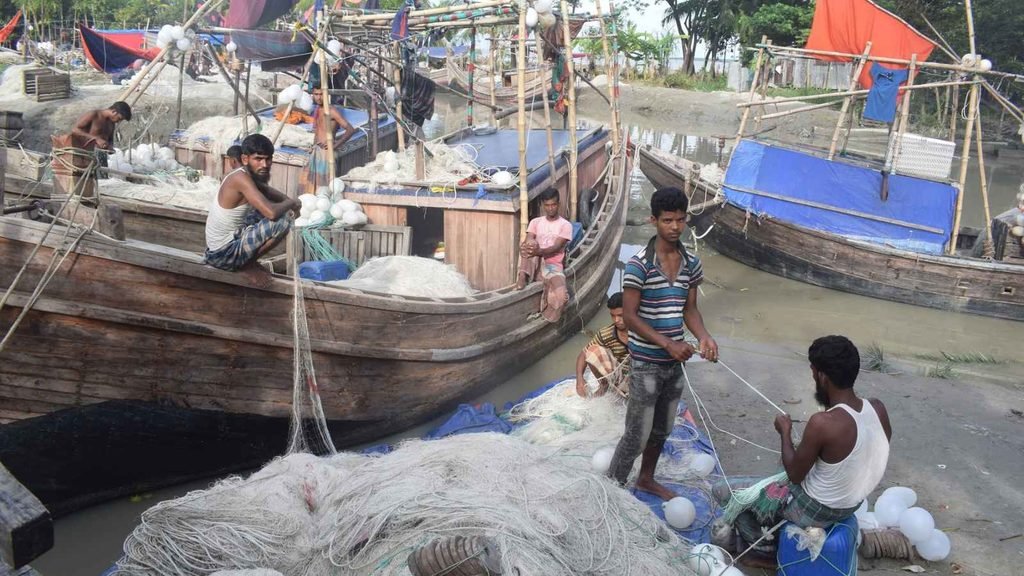
“Same nets, same boats, same rivers. Yet, the spots where we used to catch Hilsa in the past no longer yield any fish,” said Abdur Rob and several other fishermen from Kuakata on the Bangladeshi coast. They explained that as times change, they are encountering new crises while fishing at sea. Fishermen across most coastal districts—including Barguna, Patuakhali, Bhola, Bagerhat, and Lakshmipur—are grappling with professional crises. Climate change has impacted their lives and livelihoods, while natural disasters create obstacles to their fishing activities. Another group of fishermen believes that, beyond natural disasters, government-imposed seasonal fishing bans and various human-induced factors are hindering their profession.
According to records from the Bangladesh Department of Fisheries, the volume of Hilsa catch in Bangladesh began to rise in the 2016–17 fiscal year. That year, 496,000 tonnes of Hilsa were harvested within Bangladesh’s waters. In the 2017–18 fiscal year, the catch rose to 517,000 tonnes. The upward trend continued steadily until the 2022–23 fiscal year, when the harvest reached 571,000 tonnes. However, in the following year—2023–24—the catch volume suddenly dropped to 529,000 tonnes. It declined further to 500,000 tonnes in the 2024–25 fiscal year. Sources indicate that the Hilsa catch during July and August of the current year has fallen by 30–40% compared to the previous year.
According to data from WorldFish and the Department of Fisheries, Bangladesh accounts for roughly 70–86% of the world’s Hilsa catch. India lands about 10–15%, mainly in West Bengal, Odisha, and Gujarat, and Myanmar about 3–10%. The remainder is caught in the coastal rivers and seas of Pakistan, Iran, Iraq, Kuwait, Bahrain, Thailand, Malaysia, and Indonesia.
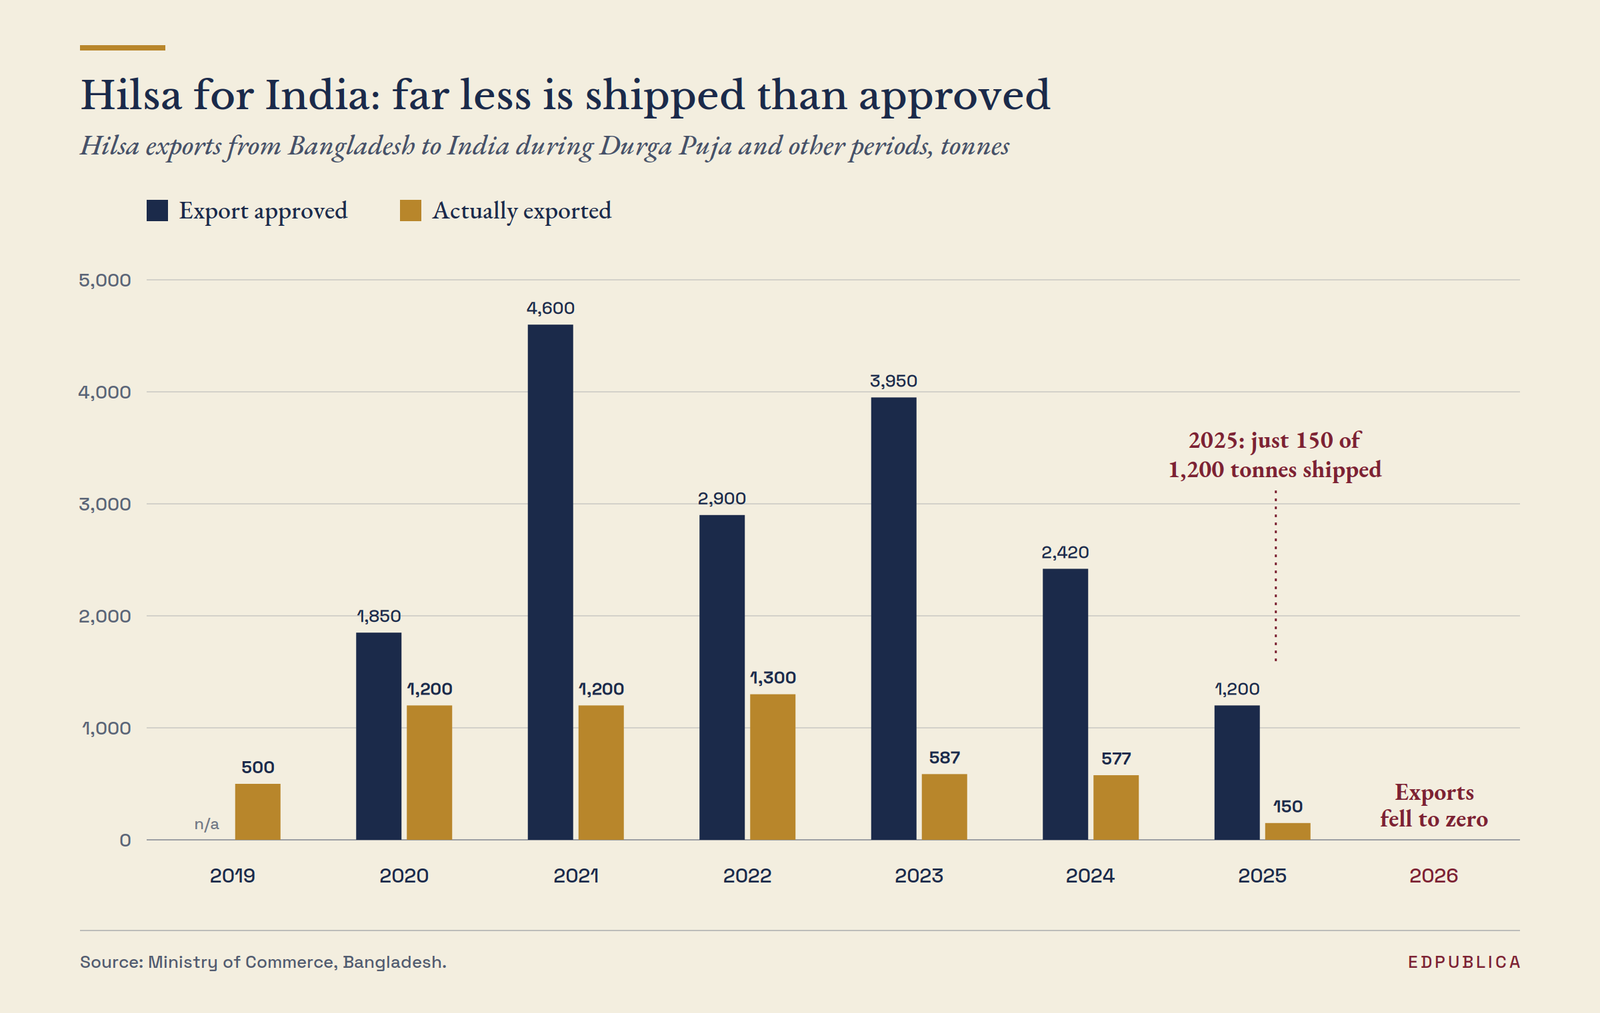
Since 2019, Bangladesh has exported Hilsa to India, particularly during Durga Puja and other occasions; this practice continued until last year. However, this year, the situation reversed, with India exporting Hilsa to Bangladesh.
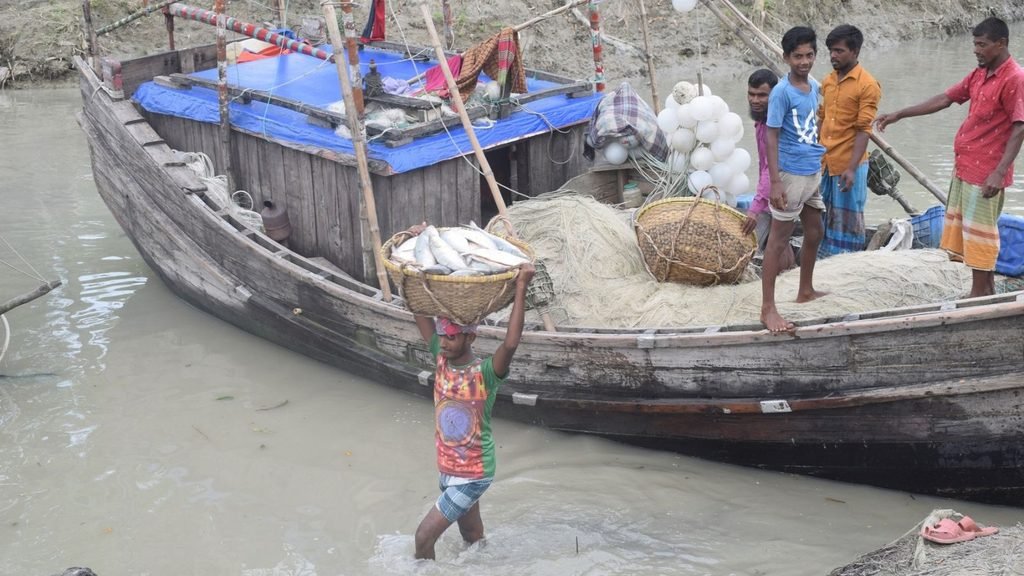
Climate change has created crises in various marine sectors, including the Hilsa fishery. As catch volumes decline, fishermen are facing new challenges. Scientists fear that marine risks will escalate in the future. A study titled “Climate Change as Observed in the Bay of Bengal” highlights the dangers posed to the marine environment by climate change. Another study by the World Bank also addresses the impact of climate change on fishermen at sea.
Hilsa Is Losing Its Favourable Habitat
Fishermen observe that coastal temperatures, rainfall patterns, and the nature of the monsoon season have all shifted. The timing of freshwater influx into rivers and coastal salinity levels are changing, as are marine environmental conditions. Collectively, these changes influence the migration and breeding cycles of the Hilsa fish. A specific combination of factors—including water temperature, salinity, currents, tides, water density, oxygen levels, and rainfall—is required to create the right conditions for Hilsa migration and spawning. However, the environment essential for the Hilsa has been significantly degraded.
Hilsa experts largely concur with these observations made by fishermen. Anisur Rahman, former Director of the Bangladesh Fisheries Research Institute (BFRI), states, “Hilsa require specific water currents and depths to migrate into inland waters. They need a water depth of at least 10 metres to navigate the rivers, but they are not finding it.”
In some areas, river depth has dropped to just 18–20 feet (about 5.5–6 metres)—far below the 75–80 feet (about 23–24 metres) required for Hilsa breeding. Furthermore, submerged shoals and sandbars have obstructed waterways between Chandpur and Monpura, leaving only narrow channels for navigation. Hilsa migrate from the sea to inland waters by swimming against the current; however, reduced river navigability and diminished water flow are hindering this migration. Hilsa from the Padma River are renowned for their superior taste, yet the fish are no longer entering the Padma in significant numbers.
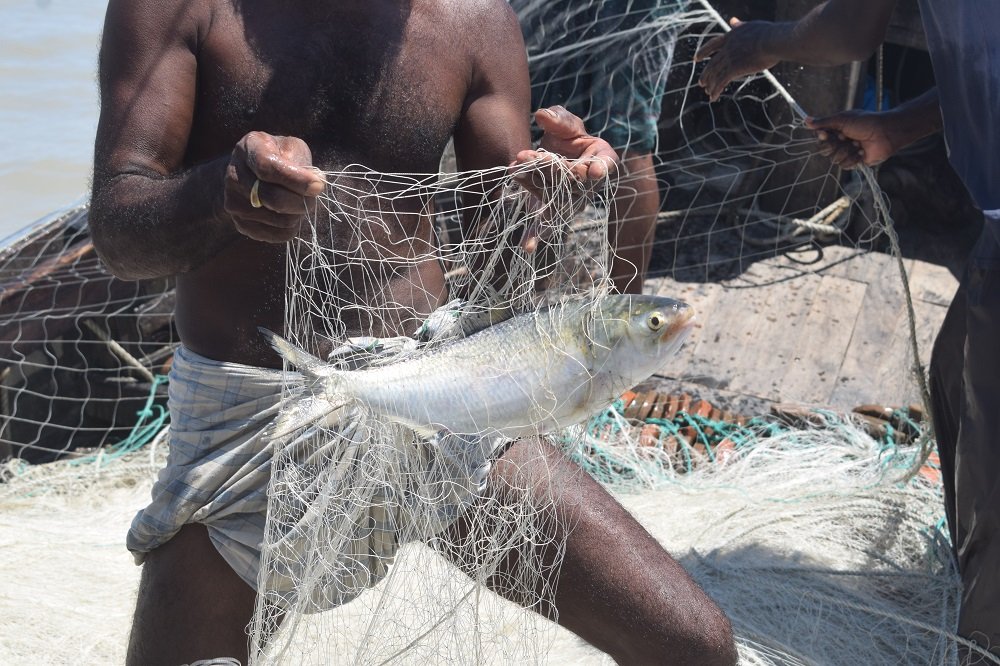
Hilsa production in Bangladesh—which had been steadily rising for two decades—is now declining. This has raised concerns regarding the survival of this popular fish and its affordability for ordinary people. Anisur Rahman has been conducting research on Hilsa for a long time. Expressing concern over the decline in Hilsa catches, he said, “I’m truly worried about the population or stock of Hilsa.”
“The fish’s food chain is being disrupted by falling water levels, rising temperatures, and changes in water quality. This balance is further destabilized by excessive heat and altered rainfall patterns caused by climate change,” added Anisur Rahman.
Dr Md Sajedul Haque, a professor in the Department of Fisheries Technology at Patuakhali Science and Technology University (PSTU), observed, “Hilsa catches used to be higher; now they are lower. This is a global problem. It is happening due to global warming.”
“If Hilsa does not find a suitable environment, it will neither stay there nor spawn. Factors such as water salinity, the availability of plankton for food, and water temperature are crucial for Hilsa. If salinity is too high, they will not spawn, or the eggs will fail to hatch and perish. Without food, they will not grow. If the temperature is not optimal, the eggs will not be fertilized, and the fry will not hatch. The Hilsa’s life cycle is directly linked to these factors,” added Sajedul Haque.
To a fisherman, climate change is not a PowerPoint presentation; it is a harsh reality and a matter of life and death.
Human-Induced Factors
Alongside climate change, human-induced factors are jeopardising the breeding of Hilsa fish. Local fishermen, trawler owners, and wholesalers engage in unregulated and illegal fishing practices. The number of illegal trawlers in the sea has multiplied significantly. Trawlers are essentially large wooden boats powered by high-capacity engines. They operate by dragging illegal ‘Behundi’ nets (bag nets) through the sea for hours using this engine power. These nets catch not only large fish but also small fish fry and juvenile Hilsa (Jatka), thereby destroying the primary breeding grounds of Hilsa and other marine species.
Three power plants are located within Hilsa sanctuaries along the Bangladeshi coast—the Payra Power Plant, the Patuakhali Power Plant on the banks of the Ramnabad Channel, and the Barishal Power Plant at Taltali on the banks of the Bishkhali River. Many have expressed concern regarding the pollution caused by these facilities. These coal-fired power plants discharge waste and heated water into the rivers. A decline in Hilsa populations has been observed since the establishment of these plants. Fishermen are no longer catching Hilsa in the Ramnabad River (Patuakhali district) and the Payra River (Barguna district) as they used to; consequently, many are turning to other professions.
Fishermen Face Growing Risks at Sea
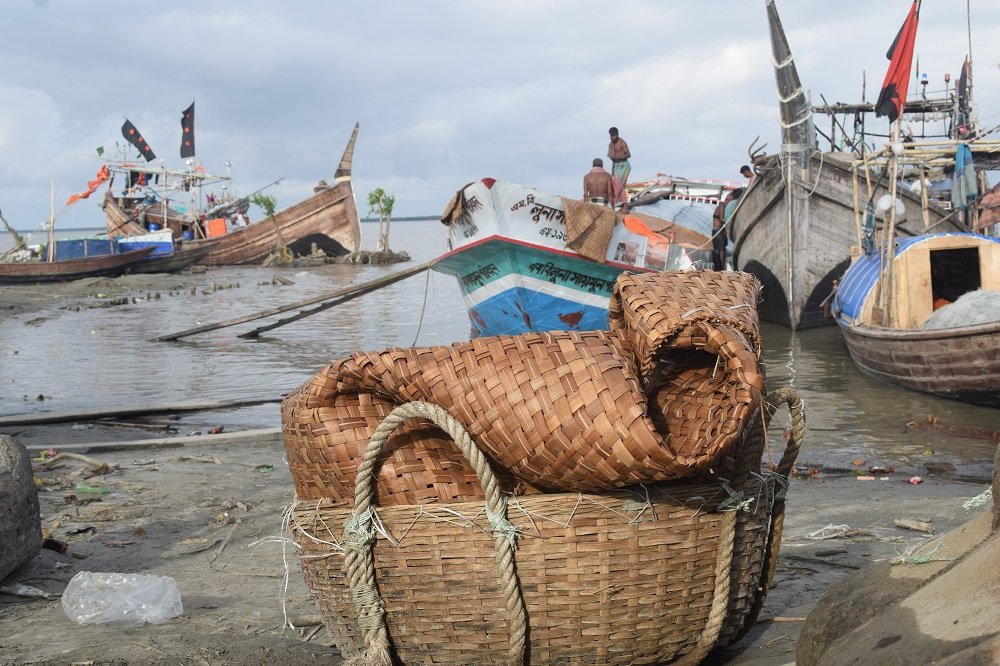
Fishermen report that while Hilsa exists in the deep sea, the fish are not migrating to shallower waters, as the environment there is no longer suitable for their survival. Small-scale fishermen face a dire crisis because the Hilsa do not venture into shallow waters, and many have already abandoned the trade. Those who remain in the profession are forced to venture into the deep sea to catch Hilsa, where they face increasing risks.
Every year, many fishermen go missing due to various natural hazards. The sea is becoming more turbulent than in the past, and the level of danger is rising. Nuruddin, a fisherman from Char Fasson in Bhola district, says, “I have been going out to sea to fish since childhood. I used to have no fear, but now venturing out to sea is frightening for us. I cannot say for certain if it is due to climate change, but the waves are rougher than before. We often face accidents because we do not receive weather warnings in time. I have personally been involved in accidents a few times; fortunately, I survived and returned.”
A study titled “Resilient Bangladesh: Fishermen Cope with Rough Seas” notes that for centuries, the fishermen’s traditional boats were sturdy enough to withstand conditions in the Bay of Bengal. That is no longer the case. Fishermen are increasingly facing more powerful storms and turbulent seas. Every time they head out to fish, they are essentially gambling with their lives.
Even as the risks for fishermen rise, fish stocks in the sea are declining, impacting their livelihoods. Despite this crisis, fishermen continue to struggle for survival. Research titled “Dwindling Coastal Fisheries Biodiversity of Bangladesh: The Causes and Effects” indicates that coastal fish stocks are being overexploited, leading to a depletion of many species. The marine sector’s contribution to the country’s fisheries is shrinking annually. According to assessments by the IUCN (International Union for Conservation of Nature), approximately 28% of coastal fish species now fall under the IUCN Red List of threatened species.
Golam Mostafa Chowdhury, President of the Barguna District Trawler Owners’ Association, states, “In most cases, fishermen go missing when their trawlers capsize. The sea has become rougher than before, and weather conditions have deteriorated. Siltation has occurred in many areas, and many fishermen fail to receive proper weather warnings. These factors are contributing to a rise in the number of missing fishermen. Rescue vessels need to be stationed in areas with high concentrations of fishermen, and arrangements must be made for the rehabilitation of those who go missing.”
Initiatives to Protect Hilsa
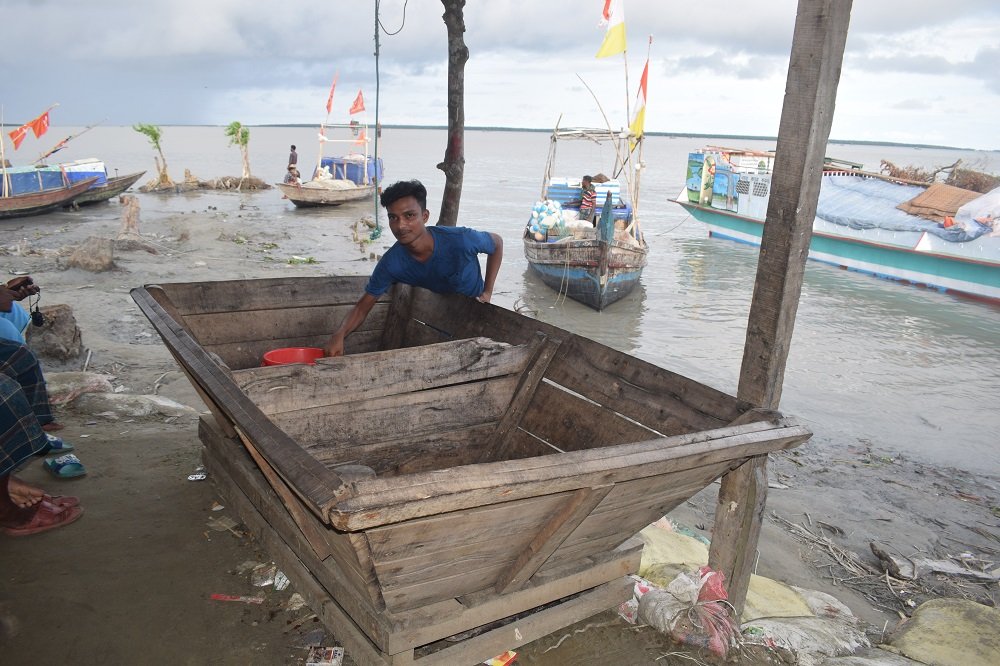
The government is taking various measures to protect the Hilsa fish. Conservation and management activities for Hilsa in Bangladesh are conducted under the Protection and Conservation of Fish Act, 1985. A programme to protect Jatka (juvenile Hilsa) was launched in Bangladesh in 2003–04, leading to a gradual increase in Hilsa production. The Jatka conservation drive runs for two months—March and April—during which fishing of all kinds, including Hilsa, is prohibited in designated sanctuaries across the country. Additionally, fishing for all species, including Hilsa, is banned in marine waters for 58 days, from 15 April to 11 June. Initially, in 2008, the ban on catching mother Hilsa (Ma Hilsh) was set for 11 days, but from the following year onwards, this period was extended to 22 days. A ban on catching mother Hilsa is in effect from 8 October to 29 October this year. For two decades, the trend of Hilsa harvesting had been on the rise; however, research is currently underway to understand why the catch rate has recently begun to decline.
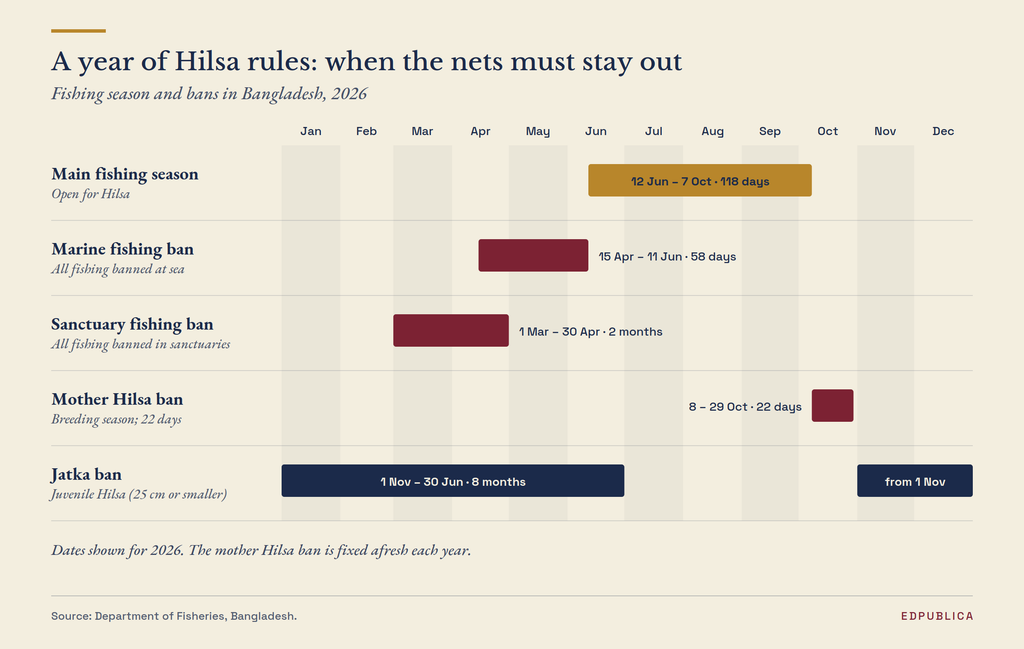
Ruhul Amin, a fisherman, is spending the final days of the Hilsa season at the Dhalchar fish landing centre. He might venture out to sea a few more times with other fishermen to catch Hilsa. Yet, amidst the crowds and grueling labor, a question weighs on his mind: will he be able to take home enough earnings to support his family for the coming months? Ruhul Amin does not know the answer—nor do many other fishermen.
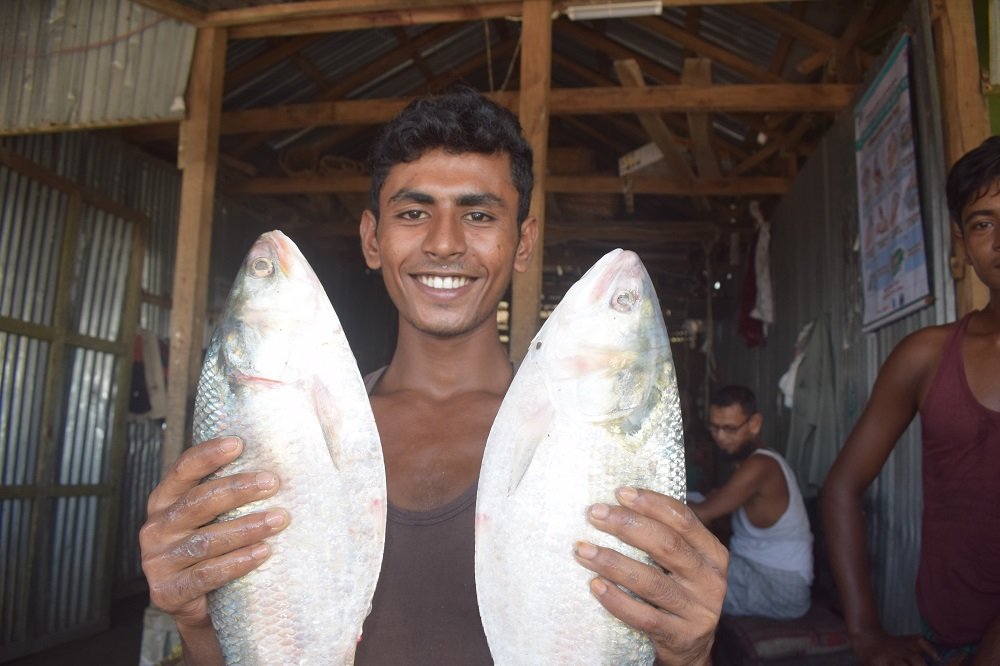
For the fishermen of Bangladesh, the Hilsa season is drawing to a close amidst a period of uncertainty. The voices of the crowd at the fish landing centre fade into the air, carrying with them the indistinct sounds of the fishermen’s suffering.
COP30
Pacific Nations Push 1.5°C and Climate Finance Ahead of COP31
Pacific nations are using Pre-COP31 talks in Fiji to push for stronger action on climate change, including keeping the 1.5°C target within reach and improving access to climate finance.
Pacific island nations are seeking to put their climate concerns at the centre of global negotiations as ministers, climate negotiators and senior officials gather in Fiji for preparatory talks ahead of the COP31 climate summit.
The Pre-COP meeting, scheduled in Nadi from October 5 to 8, is intended to build momentum for the United Nations climate conference in Antalya, Türkiye, in November. COP31 will be held from November 9 to 20.
For Pacific countries, however, the meeting is more than a diplomatic step towards the main summit. It is an opportunity to press the world’s major economies on issues that directly affect the region, particularly the 1.5°C warming limit, climate finance and the growing impact of climate change on oceans and coastal communities.
Fiji has outlined four priorities for the Pre-COP discussions: keeping the 1.5°C target within reach, improving access to climate finance, placing oceans more prominently in climate negotiations and strengthening Pacific leadership.
The 1.5°C target is particularly important for small island nations facing rising seas, coastal erosion, extreme weather and growing pressure on communities and infrastructure.
Fiji’s climate officials have said the country wants to maintain the role of climate science in international decision-making and “hold the line” on 1.5°C. The country is also calling for climate finance to reach vulnerable communities more quickly, arguing that lengthy funding procedures can leave communities waiting for resources while climate risks continue to increase.
Access to finance is expected to be one of the key issues carried from the Pacific discussions into COP31. Pacific governments are seeking greater support for adaptation and resilience, including through a proposed Pacific Resilience Facility that would finance climate projects across the region.
The region is also seeking to bring oceans more firmly into the climate agenda. For Pacific island states, climate change is closely connected to the health of marine ecosystems, coastal communities, fisheries and food security.
The preparatory talks will therefore bring together two aspects of the climate debate: the global effort to limit further warming and the immediate need to protect communities already experiencing its effects.
The setting is significant. Leaders and delegates will also spend time in Tuvalu, a low-lying Pacific island nation particularly exposed to sea-level rise. The programme includes visits to adaptation projects, including reclaimed land and solar installations, allowing visiting leaders to see some of the measures being used by island states to respond to climate risks.
But the meeting comes with a diplomatic challenge. Reuters reported that relatively few leaders from outside the Pacific have confirmed their participation. Leaders from Antigua and Barbuda, Cabo Verde, Thailand, the Maldives and Timor-Leste are among those confirmed, while around 30 representatives of countries and institutions are expected at the leaders’ segment.
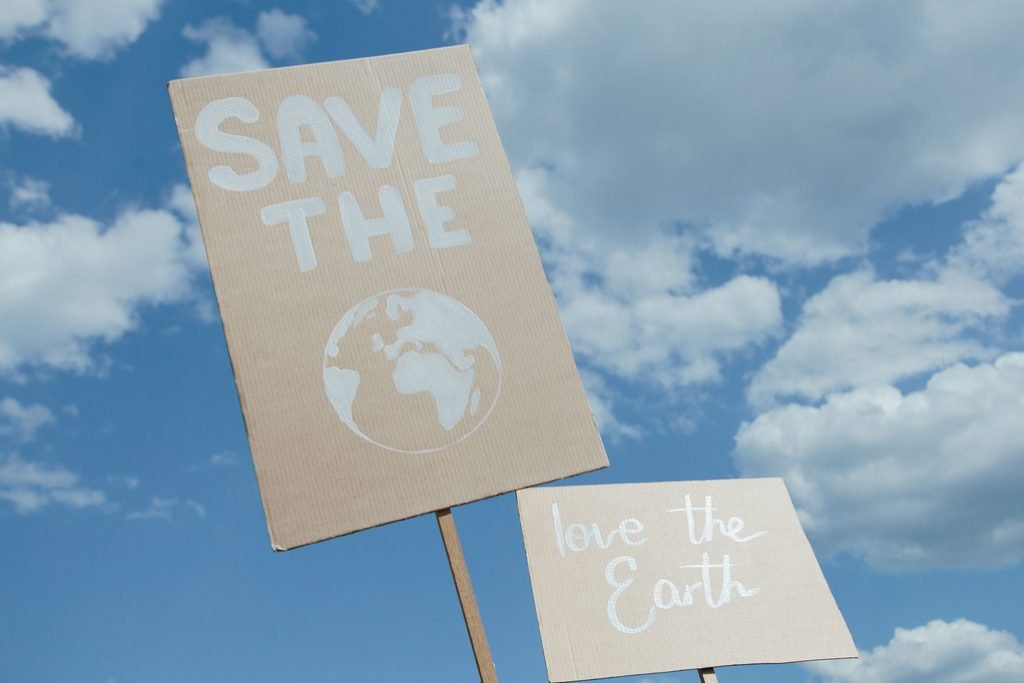
A placard displaying ‘Save the Earth’.Representational image.Image Credit:Pexels
The limited participation has drawn criticism from some Pacific officials, who argue that the region’s climate concerns deserve greater international attention. At the same time, the meeting is expected to bring thousands of delegates to Fiji, giving Pacific governments a platform to shape discussions before the main negotiations in Türkiye.
For the Pacific, the focus in Nadi will therefore be on translating regional concerns into negotiating priorities for COP31 — from keeping the 1.5°C goal central to improving access to climate finance and strengthening attention to oceans and adaptation.
The outcome of the Fiji discussions will feed into negotiations at COP31, where governments will have to work through the wider questions of climate ambition, finance and implementation.
For island nations on the frontline of climate change, the immediate priority is to ensure that their experience and demands are reflected proportionately in those negotiations.


Inside Gas Kitchens, Workers Face Heat as High as 50°C

Two Chemists Win Nobel Prize for Solving a Century-Old Puzzle: Why Life Picks One Hand Over the Other

Climate Change, Overfishing and the Uncertain Future of Bangladesh’s Hilsa Fishermen

A Dead Star Feeds Off Planet Formed From Its Ashes

Trump’s AI Accord Puts Big Tech in Charge of Its Own Safety. Is That Enough?

From Scams to Screens: How the National Stock Exchange Rewrote India’s Equity Story

Aim for the Stars: Anjali Thomas’s Journey from a Small College in Kerala to the Frontiers of Medical Imaging

India’s AI Moment Rests on More Than Code

Marshall Islands: Why the US Nuclear Legacy Is Back Before the UN

From Silicon Valley to Sustainable Period Care; How This Engineer Is Rethinking Menstruation with Science

-

 Math3 months ago
The 2026 Fields Medals: Four Proofs, Four Decades-Old Problems Solved
-
Climate2 months ago
After Kerala’s Deadliest Landslide, the Hardest Thing to Rebuild Was Childhood
-
Society3 months ago
West Asia Crisis: Can Kerala’s Returning Gulf Migrants Find a Future in the Green Economy?
-
Space & Physics4 months ago
India Semiconductor Mission: ‘It’s Not About Fabs. It’s About Building An Entire Ecosystem’
-
Interviews2 weeks ago
From Scams to Screens: How the National Stock Exchange Rewrote India’s Equity Story
-
Climate4 months ago
The Climate World Cup? How Climate Change Could Affect Player Performance at the 2026 World Cup
-
Society3 months ago
What Is Civilisational Diplomacy? Understanding India’s Newest Foreign Policy Tool
-
Society4 months ago
From Bell Labs to the Classroom: A Second Career in Teaching