Sustainability
100% Access in China, 5% in South Sudan: The Global Electricity Gap
China has 100% electricity access, while South Sudan has just 5.4%. India and Nigeria show how access, consumption and demand reveal a deeper global electricity gap.


China and South Sudan are separated by more than 10,000 kilometres. They are also at opposite ends of the world’s electricity-access divide. In 2023, electricity access reached 100% of China’s population, compared with just 5.4% in South Sudan. India was at 99.5%, while Nigeria stood at 61.2%, according to World Bank data. This electricity gap sits along with global access rate was 91.6%.
But access tells only part of the story. The International Energy Agency estimates that people in sub-Saharan Africa consume about 200 kilowatt-hours (kWh) of electricity per person each year, compared with around 7,000 kWh in advanced economies and China. Meanwhile, about 730 million people still lacked electricity access in 2025, more than 80% of them in sub-Saharan Africa.
At the other end of the spectrum, global electricity demand is rising rapidly. It grew by about 3% in 2025, more than twice as fast as total energy demand. China alone accounted for 58% of the increase, with its net electricity demand exceeding 9,500 TWh.
This is the contradiction at the heart of the world’s “Age of Electricity”: while some economies are preparing to run more of their cars, factories and buildings on electricity, hundreds of millions of people are still waiting for reliable access to basic services.
The Electricity Gap: One Transition
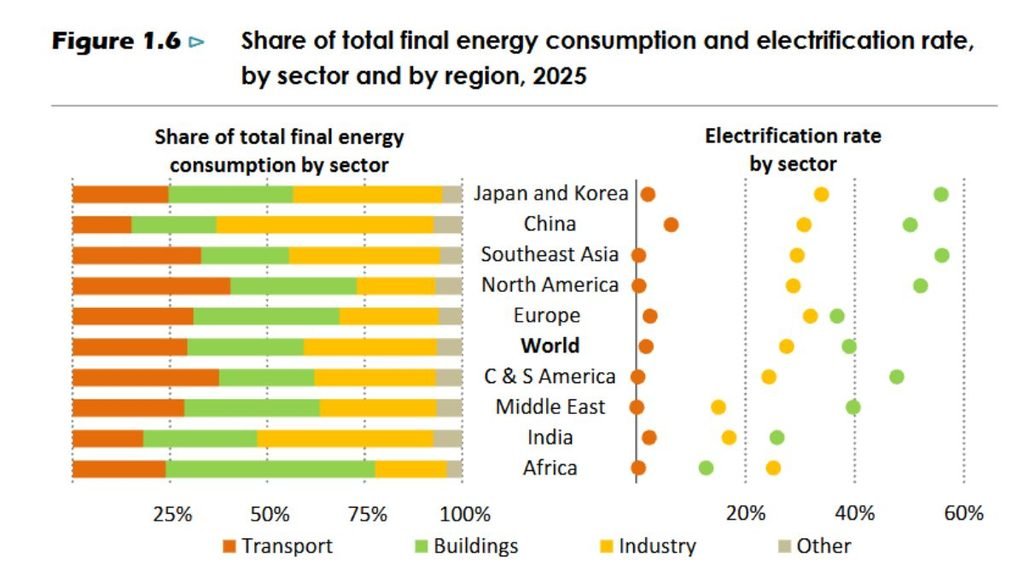
For countries with near-universal access, the next phase is largely about increasing electricity’s role in transport, buildings and industry. For countries with major access gaps, the priority remains connecting households and businesses and making that electricity reliable and affordable. The IEA’s figures show why these stages cannot be treated as a single global transition. Electricity can be a basic service in one economy and the backbone of an industrial and digital economy in another.
South Sudan: Access is Still the Challenge
South Sudan’s 5.4% electricity-access rate means roughly 95% of its population remained without access in 2023. The World Bank has identified it as having the world’s lowest national access rate. The problem is not simply a shortage of generating technology. Building electricity infrastructure in countries with weak grids, dispersed populations and difficult financing conditions is expensive. Off-grid and mini-grid systems are particularly important where conventional grid expansion cannot reach everyone quickly.
The IEA estimates that universal electricity access could be achieved around 2035 under an accelerated-access scenario. That would require about 80 million people gaining access every year, including around 70 million annually in sub-Saharan Africa.
The proposed mix is also revealing: about 45% of new connections through grids, 30% through mini-grids and 25% through solar home systems. The IEA estimates that this would require about $23 billion a year in investment.
Connecting everyone would add only about 160 TWh of electricity demand by 2035—around 0.6% of today’s global electricity demand. Sub-Saharan Africa would account for about 90 TWh of that increase. The constraint, therefore, is less about the world’s overall electricity supply than about investment, infrastructure, institutions and the ability to extend electricity to productive economic activity.
Nigeria: Not Simple Yes-or-No Question
Nigeria shows the next stage. About 61.2% of its population had electricity access in 2023. That leaves a large share of the population without electricity despite the country’s much larger electricity system and economy.
Extending access is only part of the challenge. Electricity becomes economically significant when it can reliably run irrigation pumps, refrigeration, machinery, communications and health services. The IEA describes these as productive uses that can increase incomes and help households afford electricity.
An electricity-access percentage can therefore hide an important part of the story. Being connected is not the same as having enough reliable electricity to participate fully in a modern economy.
India: Rapidly Changing Demand
India has largely crossed the first access barrier. World Bank data put electricity access at 99.5% in 2023, compared with 61.2% in Nigeria and 5.4% in South Sudan. Its challenge is increasingly about scale, timing and the source of electricity.
India’s electricity demand grew rapidly for much of the past decade. But 2025 was an exception: demand rose only 1.4%, after four consecutive years of growth above 6%. The IEA attributes much of the slowdown to an early, intense monsoon that reduced cooling demand and electricity use for agricultural pumping.
The IEA expects India’s electricity demand to grow by an average 6.4% a year between 2025 and 2030, adding more than 570 TWh to annual consumption. Cooling alone is expected to account for more than one-fifth of that growth.
This creates a different set of infrastructure pressures. Solar generation peaks during daylight, while demand increasingly extends into the evening. Storage, flexible demand, electricity pricing and stronger grids become important. The IEA also identifies industrial electrification as an opportunity: nearly 30% of India’s industrial heat demand is below 150°C, where electric technologies can potentially replace fossil-fuel use.
China’s Electricity is Already the Backbone
China represents another stage. Electricity access is universal, but electricity demand is enormous. China’s net electricity demand exceeded 9,500 TWh in 2025, rising 5.1% from the previous year. China alone contributed 58% of global electricity-demand growth.
Industry remains a major driver, while electric vehicles, air conditioning and appliances are adding demand in buildings and transport. At the same time, China’s generation mix is changing. In 2025, renewables accounted for 34% of global electricity generation, while coal remained the largest source at 34%. In China, coal’s share of generation fell to 55% in 2025 from 70% a decade earlier, as renewable and nuclear generation expanded.
The challenge is therefore supplying one of the world’s largest electricity systems while reducing its dependence on fossil-fuel generation.
The gap Measured in Consumption
The difference between countries becomes even clearer when electricity use per person is considered. In Sub-Saharan Africa region, 200 kWh is the electricity use per person a year. Advanced economies and China average around 7,000 kWh. That roughly 35-fold difference reflects income, industry, appliance ownership, cooling, transport, infrastructure and the availability of electricity for productive activity.
It also explains why access rates alone are insufficient. The first electricity connection can provide lighting, refrigeration or healthcare. In a high-consuming economy, additional electricity may support electric vehicles, cooling, industrial production or data centres.
Electricity is therefore both an energy issue and a development issue, but the priorities differ sharply across countries.
One Global Target, Different Starting Points
The IEA’s High Electrification Scenario envisages electricity rising from about 23% of global final energy consumption today to 35% by 2035. Reaching that level would require major additions of clean generation, grids, storage and demand flexibility.
But the global picture cannot be reduced to that target. South Sudan is still working towards basic access. Nigeria faces a large access gap alongside questions of reliability and productive use. India is managing rapidly growing demand and a changing generation profile. China is managing one of the world’s largest electricity systems while reducing the role of fossil fuels.
The world is therefore not moving from a common starting line. The electricity gap is measured not only in access rates, but also in 5.4% versus 100% access, 200 versus 7,000 kWh per person, and the very different economic activities that electricity enables. The Age of Electricity may be global. Its starting points are not possibly deepening the inequality.









Society
When a Village Walks Together, Even Drought Is Defeated. How Halma Breathed Life Back into Kesarpura’s Pond
How a traditional Halma brought Kesarpura villagers together to restore a pond, strengthen water security and revive community-led conservation.

About 22 kilometres from the Petlawad block headquarters in Jhabua district of Madhya Pradesh, the village of Kesarpura has a story to tell, one about the confidence of an entire community. A Halma was held here on 19 May 2026, and what followed convinced the village that the solution it had long sought from outside had been within it all along.
Halma is a word from the Bhili dialect, often translated as a “call for help”, and it means collective voluntary labour. When a family in the Bhil community is weighed down by a burden, whether raising a house, bringing in a harvest or facing a calamity, the word goes round the village and people come, unpaid and with their own tools, to stand by them. The message is simple: you are not alone. In Jhabua the tradition has also been turned to the work of saving water. Since 2009 the local organisation Shivganga has organised large Halmas for soil and water conservation, and one in February 2020 drew some 20,000 people from about 500 villages.
Kesarpura’s only pond had been waiting for exactly this tradition. Years of neglect had left it so choked with silt and weeds that its depth was shrinking, and so was its capacity to hold water. Seepage through one stretch of the embankment quietly drained away the rainwater it collected. This is a tribal district, where Scheduled Tribes made up about 87 per cent of the population at the 2011 Census, and a hilly one: as the district administration itself notes, water runs off the slopes instead of being held by the soil, so even good rainfall can leave villages short of water. In such a landscape a failing pond meant a direct threat to a full year of farming and to the water that livestock depend on. As summer set in, the pond bed would fill with cracks, and the village’s hopes would drain away with it.
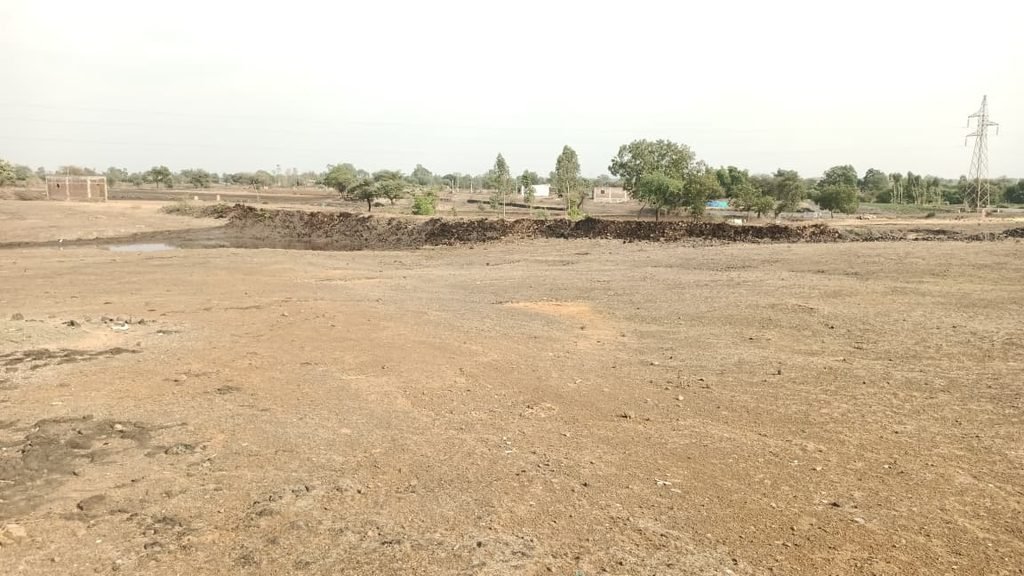
Before the Halma: a dry pond bed, heaps of silt and seepage along the embankment. Photo: Mukesh Porwal, Block Facilitator, VAAGDHARA
The village knew the problem was big, but it also knew the solution lay in its own hands. With the support of the Gram Swaraj Samuh, a village self-governance group of ten women and ten men formed by VAAGDHARA, it was decided that a Halma would be held at the pond. The idea was not new to the area: less than a fortnight earlier, on 6 May, villagers of Borpada, also in Petlawad, had used a Halma to clear a silted public well after repeated appeals to the panchayat brought no result. On the morning of 19 May, Kesarpura showed its true strength.
It began not with speeches or formal announcements but with the beat of the dhol, kundi and thali. A rally wound through the village. Children ran ahead carrying a banner that read “Traditional Halma Method,” with the slogan beneath it: “Save water regularly, and the future is secure.” Behind them walked elders, youth and women, with someone from every household carrying a pickaxe, a spade or a metal pan.
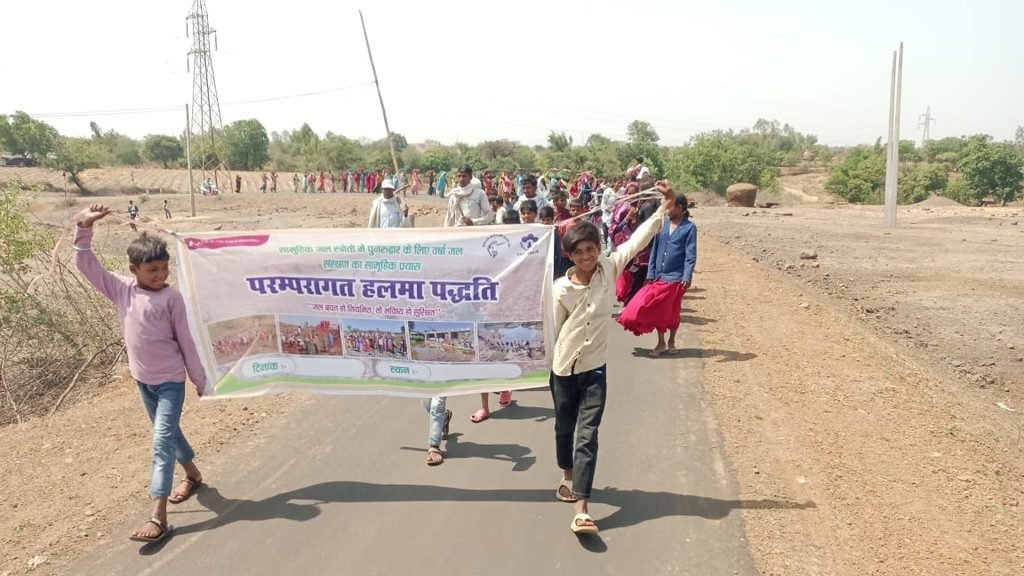
The rally sets out to the beat of the dhol and thali, with a banner reading “Traditional Halma Method”; enthusiastic children lead the way. Photo: Mukesh Porwal, Block Facilitator, VAAGDHARA
Around 150 people gathered at the pond for the Halma. There is no attendance register and no list; people come of their own accord and leave having done more than they thought they could. Under the blazing sun, heads were covered with gamchas and dupattas, yet faces glowed instead of showing fatigue. The work divided itself. Some waded into the pond to cut the weeds, others dug out silt with pickaxes and spades, and the silt was loaded into pans and basins and handed to a long line of women. The pans passed from hand to hand and head to head, and the silt made its way out of the pond.
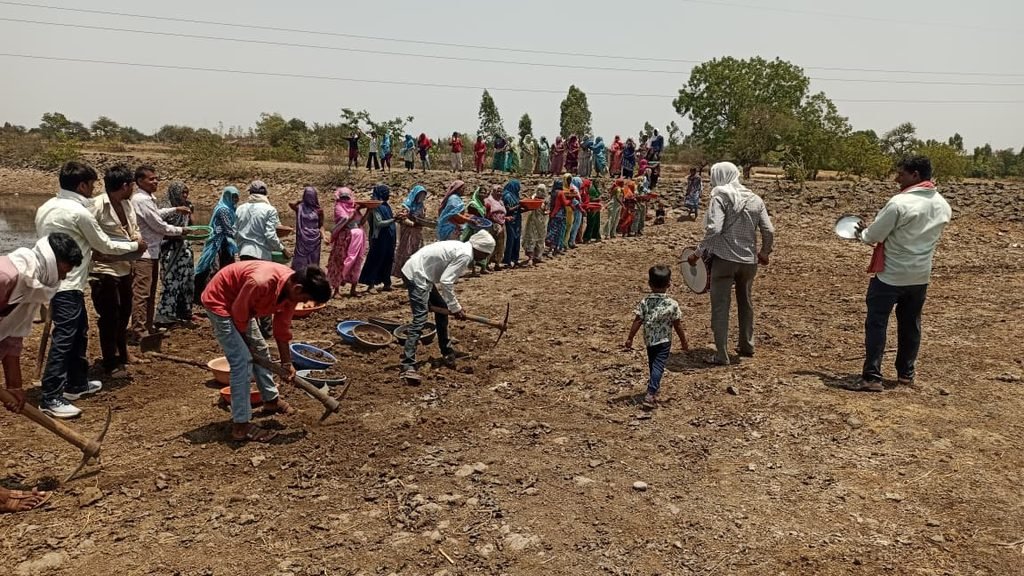
Men wielding pickaxes and spades on the pond bed, while women stand in line holding pans. Photo: Mukesh Porwal, Block Facilitator, VAAGDHARA
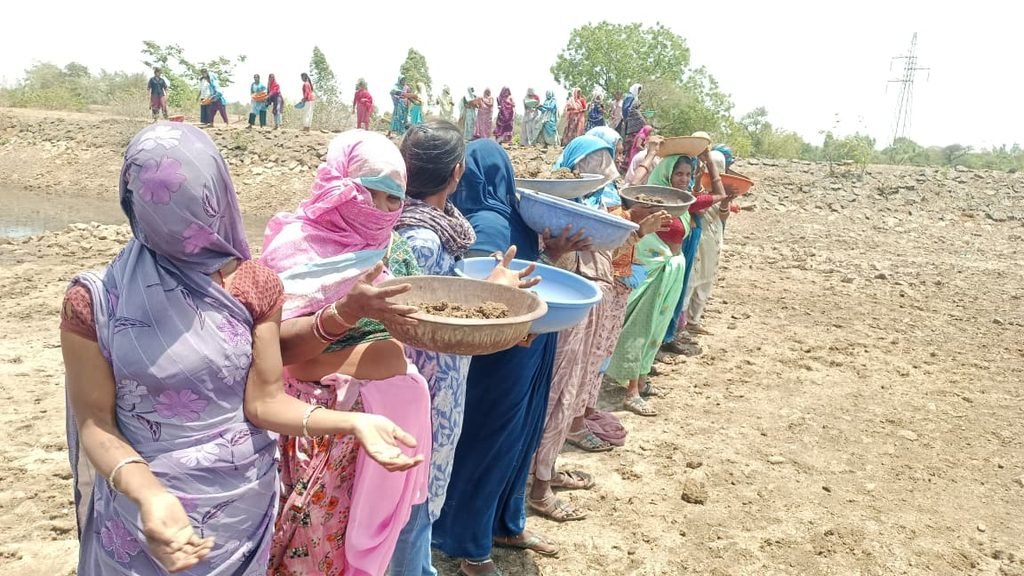
The role of women was the most remarkable part of the scene. Amid their household responsibilities, they stayed at the pond all day. Recalling that day, Basanti Ninama says that when the dhol sounded she could not sit at home, and standing in line with a pan on her head, it felt like work in her own courtyard.
“I was tired, but my heart felt light. I felt I was doing something for my village.”
– Basanti Ninama
Everyone also worked together to pile soil on the embankment where water had been seeping out, pressing it down and strengthening it. Clearing silt and weeds and strengthening the earthen bund are the standard steps in restoring a village pond, and those who know water conservation understand that the strength of the embankment and the depth of the pond decide how long a water body lasts. When noon came, the tools were set down, but the bond of togetherness did not break. Lunch, too, was cooked by everyone together on the pond’s bank. The women wove plates from tree leaves, and then everyone sat in a long row on colourful mats. An elderly woman and a small child ate the same meal on the same mat, and the true meaning of Halma came alive right there. Here, trust takes the place of accounts, and hard work and celebration blend into one another.
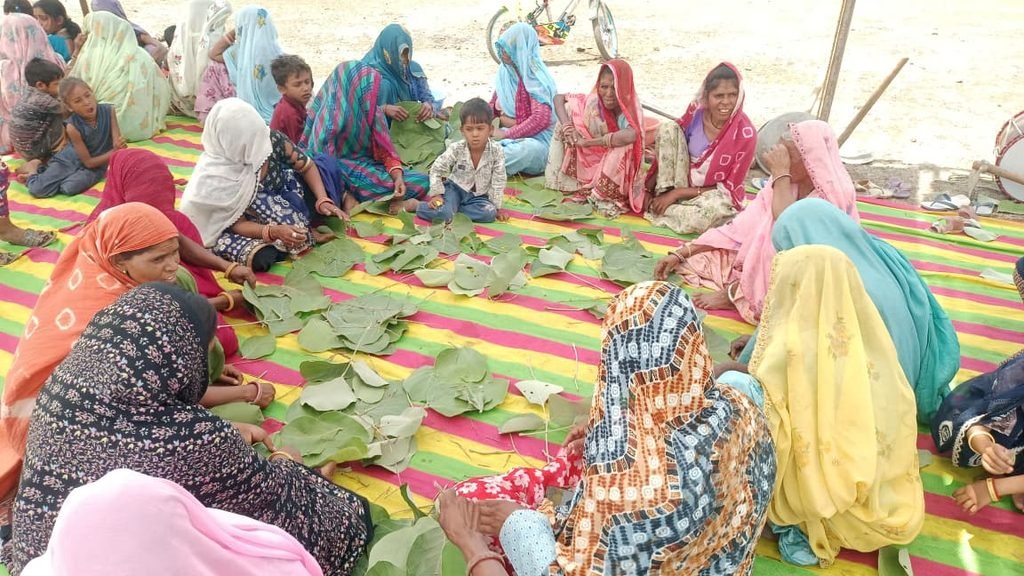
Women making leaf plates: even the preparation of the meal was a collective effort. Photo: Mukesh Porwal, Block Facilitator, VAAGDHARA
The simplicity of the leaf plate is a lesson in itself. A plate made from tree leaves leaves no plastic waste and needs no water for washing. Leaf plates have long been part of community feasts across India, and researchers describe them as a renewable alternative to plastic disposables. At an event whose very purpose is to save water, this goes beyond symbolism and becomes practice. Traditions often carry such eco-friendly solutions quietly, without any announcement.
Those who restored the pond that day included Basanti Ninama, Ganga Ninama, Surta Ninama, Sundar Mavi, Anadu Maida, Devli Mori, Phula Katara, Seema Maida, Anita Katara, Kala Ninama, Sukhram Maida, Ukarlal Maida, Mansingh Ninama, Ukar Ninama, Laxman Ninama, Dilip Vasuniya, Gendu Mori, Khima Mori, Anil Maida and Sunil Katara. Though they differ in age and family, their experiences seem threaded on a single string. For Ganga Ninama it was an emotional day: generations of her family have drunk this pond’s water, and it pained her to see it buried under silt.
“The day the pond was cleaned, I felt we had repaid our debt.” – Ganga Ninama
For men like Sukhram Maida and Anil Maida, the experience changed the way they thought. They used to believe that work on the pond was the government’s job, but on the day of the Halma they realised that when a village comes together, it has no one to wait for. “Before the Halma, we thought the government would do this work. This time we understood that when the village becomes one, we don’t have to wait for anyone.” – Anil Maida. The thought was not unique to Kesarpura: at the Samuh meeting in Borpada, someone had remarked that waiting for the government could cost another three years.
“It was very hot, but nobody complained. We want our children to see how work for the village is done.” – Devli Mori
During the event, Paramesh Patidar, Implementation Leader at VAAGDHARA, spoke with the villagers and explained that Halma is not merely voluntary labour but a tradition of standing by one another in joy and sorrow and sharing collective responsibility.
Behind the scenes, Block Facilitator Mukesh Porwal and his team also played a vital role, working at every level from mobilising people to planning the work. The steady guidance of Team Leader Dharmendrasingh Chunawat gave direction to the entire effort.
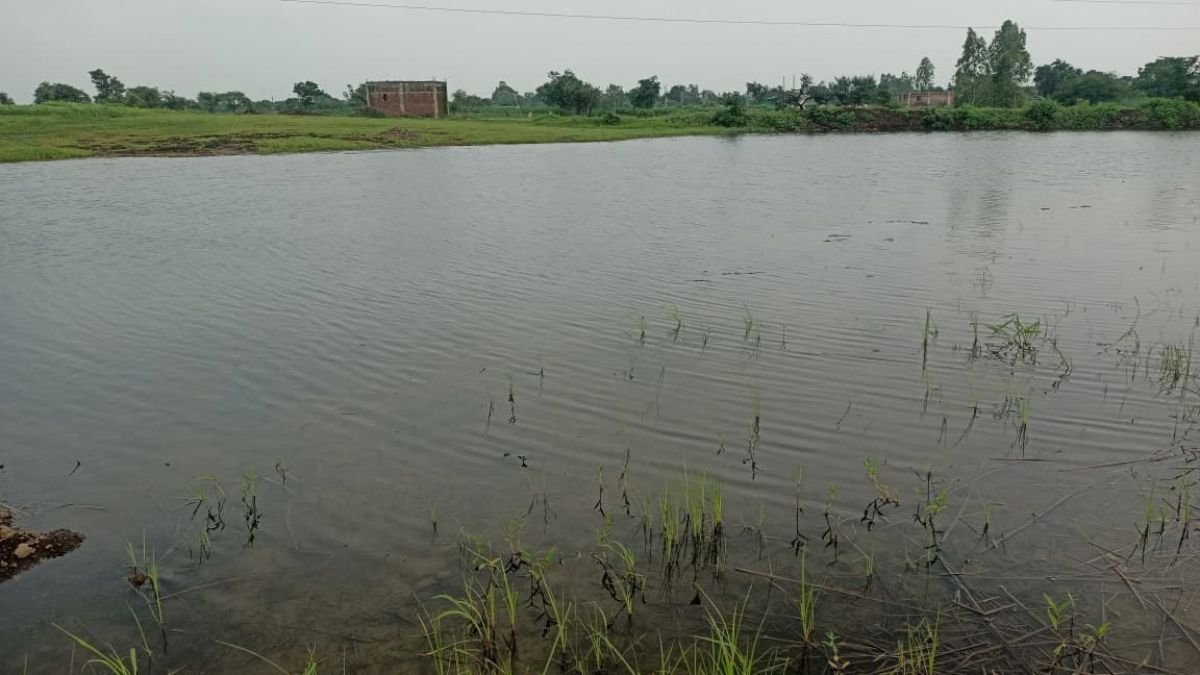
After the Halma the village returned to its routine, but nobody expected the result to show so soon. The monsoon turned out weaker than hoped. The India Meteorological Department had forecast a below-normal season, and by late July Jhabua was among the Madhya Pradesh districts reporting rainfall 33 to 45 per cent below normal; by 9 September the district’s shortfall stood at about 36 per cent. There was every fear that the pond would once again be left only partly filled. But about three months later, around August 2026, when villagers looked towards the pond, it was filled to the brim with water.
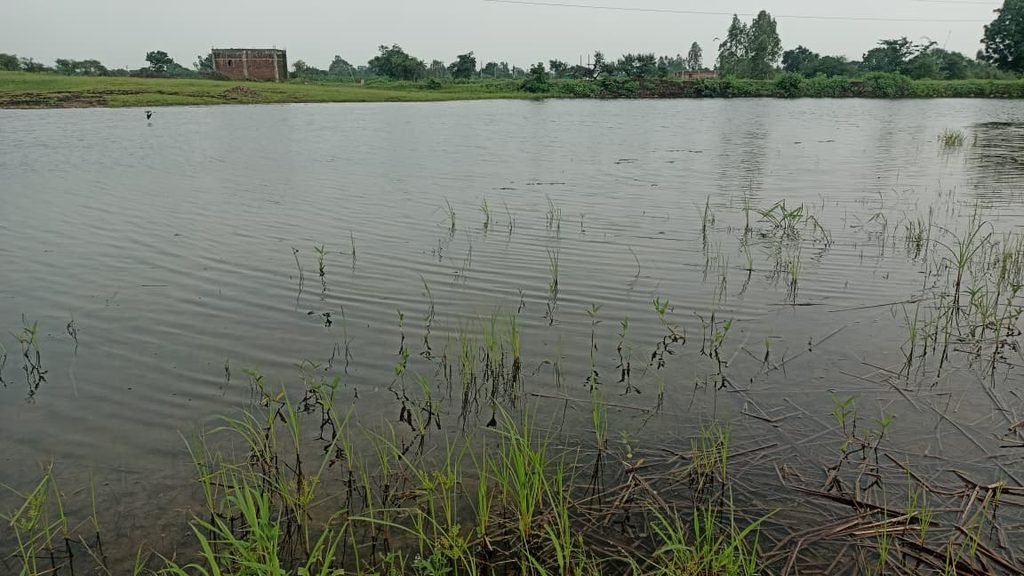
Where dust once flew, calm water now stretches far into the distance; the green grass sprouting along the edge is proof of life’s return. Photo: Mukesh Porwal, Block Facilitator, VAAGDHARA
The greatest joy was that the seepage through the embankment had also stopped. The water that came had stayed. For farmers like Sunil Katara and Mansingh Ninama, the meaning was direct: their fields will get irrigation and their cattle will have drinking water.
It is worth asking why such ponds last. Studies of India’s water infrastructure describe a recurring cycle of construction, neglect and rebuilding, with upkeep after construction as the weak link, and village ponds that were once maintained by the communities who used them fell into disrepair as that responsibility moved elsewhere. Experience shows that when a water structure is built from outside by a contractor, its upkeep often becomes nobody’s responsibility; the embankment breaks, the silt returns, and within a few years the pond can be back to its old state. A structure built through voluntary labour creates an emotional bond. Someone who has put soil into it with their own hands cannot bear to see it deteriorate. This is Halma’s greatest invisible achievement: along with the structure, it raises a whole generation of guardians. One good season in a poor monsoon is encouraging, but it is early evidence rather than proof; how long the pond lasts will depend on the desilting and embankment care the village now commits to.
The hopes ahead are considerable. In the rabi season, when fields need water the most, this stored water can become the farmers’ mainstay. With water standing in the pond, groundwater levels in nearby wells and hand pumps may also improve; case studies of desilted village ponds in Maharashtra’s Marathwada region report that nearby borewells recharged and the irrigated area grew in both the kharif and rabi seasons. Greenery is returning to the embankment, and guarding it is now the village’s shared responsibility. Remove the silt, bind the embankment, hold the rain, raise the groundwater, then irrigate the fields: this entire cycle of water conservation now appears to be complete in Kesarpura.
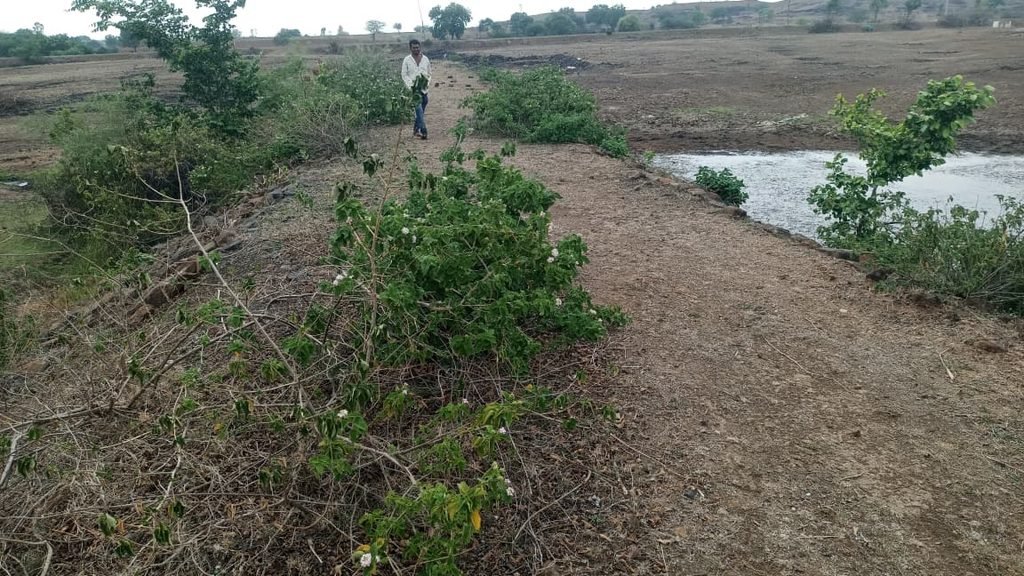
Greenery on the strengthened embankment, with still water on one side. Photo: Mukesh Porwal, Block Facilitator, VAAGDHARA
One sees the tradition of the elders and the labour of the young, the support of women and families, and above all a collective resolve to do something for one’s own village.
Kesarpura’s story is a reminder that development does not always wait for help from outside. In a country where, by NITI Aayog’s 2018 assessment, some 600 million people face high to extreme water stress, and where even large investments in water structures struggle with upkeep once they are built, examples like this show that the key often lies in local knowledge and community ownership. Three things together have given this pond a new lease of life: tradition meeting present-day need, institutions staying in the role of facilitators (in Borpada, too, the Samuh gave villagers room to decide for themselves rather than handing them ready-made answers), and a village that regards its resource as its own. Halma did not remove only silt and weeds from Kesarpura’s pond; it rekindled hope in people’s hearts, and today that hope is as clear as the pond’s water.
Sustainability
CNG, Hybrids and EVs Overtake Petrol in India’s Passenger Vehicle Market
India’s passenger-vehicle market is moving beyond petrol, with CNG, hybrids and EVs together accounting for 41.95% of August sales. The shift shows how cost, convenience and vehicle use are reshaping consumer choices.

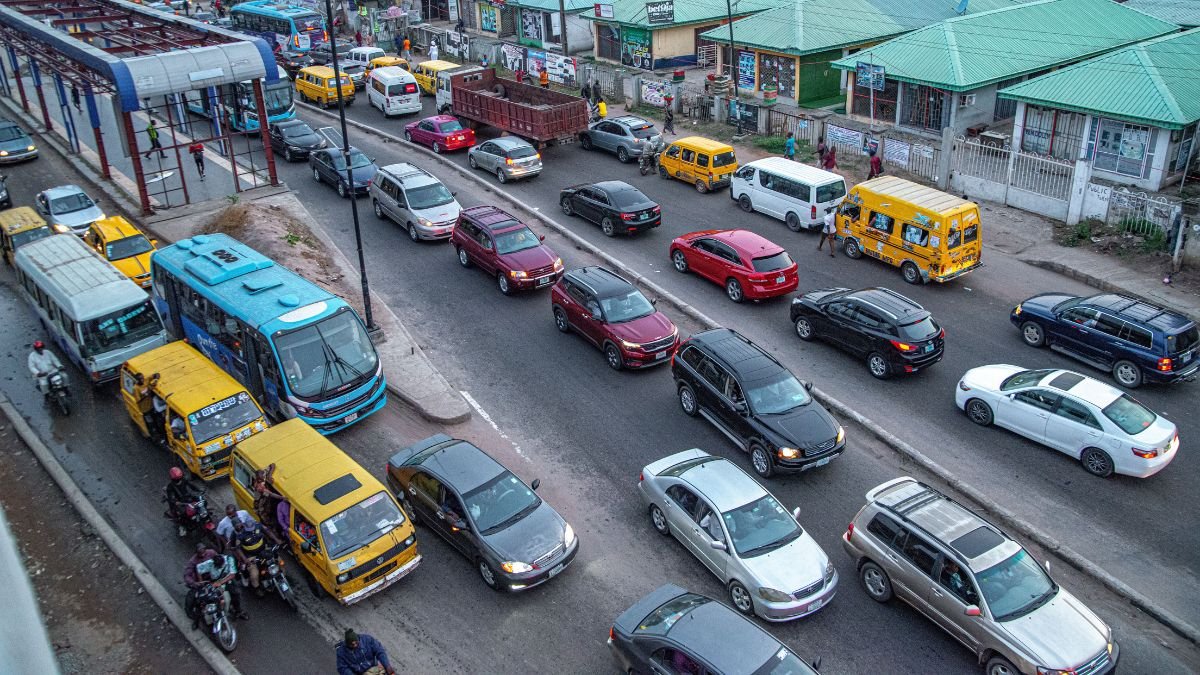
India’s car vehicle market has crossed a significant threshold. In August, CNG, hybrid and electric vehicles together accounted for 41.95% of passenger-vehicle retail sales, narrowly overtaking petrol at 40.85%. For years, petrol has been the default choice for Indian car buyers. But now, data shows CNG accounted for 25.28% of passenger-vehicle sales, hybrids for 9.04% and electric vehicles for 7.63%. Together, they made up 41.95%, compared with petrol’s 40.85%.
The gap is only 1.1 percentage points. But the direction of the change is more significant than the margin. Just a year earlier, petrol had an advantage of nearly 11 percentage points over the combined alternative-fuel category. The data, released by the Federation of Automobile Dealers Associations (FADA), comes against the backdrop of a rapidly expanding passenger-vehicle market. Retail sales reached 4,02,398 units in August, up 16.14% from August 2025 and the first time monthly August sales crossed four lakh.
CNG Still Does Most of the Work
The numbers also show that India’s transition away from conventional petrol is not being driven by electric cars alone.
CNG remains by far the largest alternative, accounting for more than a quarter of passenger-vehicle retail sales. Its appeal is relatively straightforward: lower running costs without the range and charging concerns associated with battery-electric vehicles.
Hybrids occupy a different space. They allow buyers to reduce fuel consumption while retaining the convenience of a conventional refuelling network. Their 9.04% share indicates that consumers are increasingly willing to pay for fuel efficiency without making the complete switch to an electric vehicle. EVs accounted for 7.63% of passenger-vehicle retail sales. That remains a minority share, but the broader picture becomes more striking when other vehicle categories are considered.
Two-wheelers are Moving Faster
Electric two-wheelers crossed a new threshold in August. Of the 17,14,610 two-wheelers retailed during the month, 10.68% were electric. It was the first time their share crossed 10% in a non-festival month, compared with 7.66% in August 2025. Overall two-wheeler retail sales grew 19.69% year on year, although they fell 5.70% from July.
The three-wheeler market is even further along. Electric models accounted for 65.30% of three-wheeler retail sales in August. That contrast is important. India’s vehicle transition is not happening at one uniform speed. Where vehicles are driven intensively and operating costs have a direct effect on earnings — particularly in commercial and three-wheeler applications — electric powertrains are already gaining much stronger market share.
Commercial vehicles are moving more gradually. Electric models accounted for 5.18% of commercial-vehicle retail sales in August, up from 2.06% a year earlier. Total commercial-vehicle sales reached 90,769 units, a 14.45% year-on-year increase.
A Record Market, But not Without Warning Signs
Across all categories, Indian automobile dealers retailed 24,23,201 vehicles in August, up 17.51% from a year earlier. Two-wheelers, passenger vehicles, commercial vehicles, tractors and three-wheelers each recorded their highest-ever August retail volumes, according to FADA. But the month-on-month picture was weaker. Total retail sales were 6.48% below July, when the industry had recorded a record month.
The decline does not necessarily signal a reversal in demand. FADA attributed part of it to the seasonal monsoon lull and the timing of the festival calendar, with Ganesh Chaturthi and some Onam-related buying shifting into September. The passenger-vehicle market also faces a less visible problem: stock.
Dealer inventory increased to around 38–40 days, compared with FADA’s recommended 21 days. More than half of passenger-vehicle dealers reported higher inventory than in July. That leaves manufacturers and dealers heading into the festive season with strong demand expectations but also a substantial amount of stock to manage.
The E20 question
The fuel transition is also unfolding amid India’s move towards higher ethanol blending in petrol. FADA says dealers are reporting some consumer hesitation around the E20 transition, petrol containing up to 20% ethanol, with running costs and fuel economy among the concerns cited.
That should not be read as proof that E20 is driving the entire shift. The rise of alternative powertrains has several overlapping explanations: greater model availability, lower running costs, improving EV technology and a wider consumer choice than existed a few years ago. But the timing is notable. Buyers who are uncertain about the long-term economics of petrol vehicles now have more alternatives to choose from.
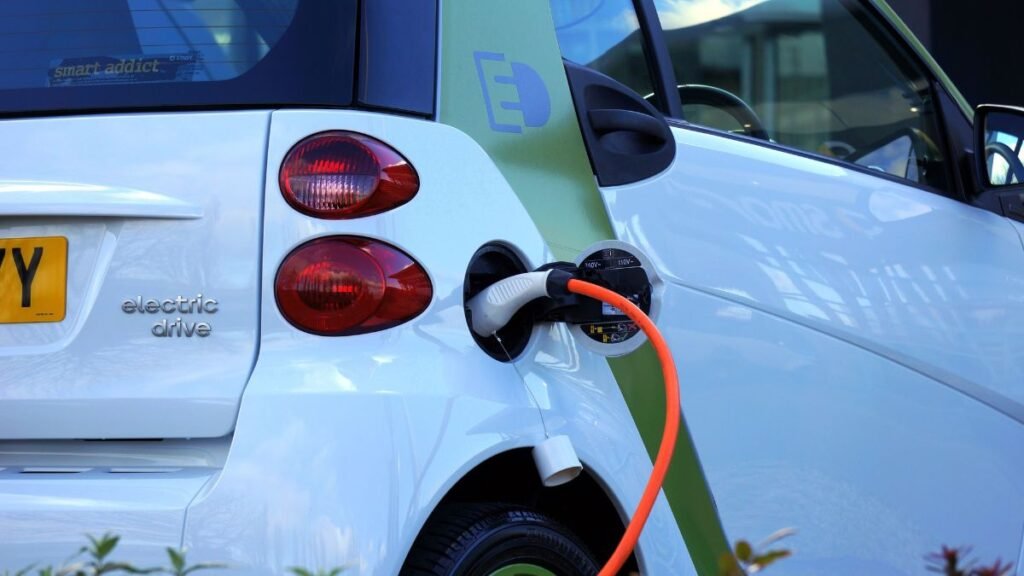
What the August numbers really show
The headline figure is not that petrol cars have suddenly become unpopular. Petrol remains the largest single fuel category in India’s passenger-vehicle market. The more important change is that there is no longer one dominant alternative to petrol. CNG, hybrids and EVs are each attracting different kinds of buyers and together they have become a larger force than petrol.
The shift is even clearer in other segments. Electric vehicles already dominate three-wheelers and have crossed 10% of two-wheeler retail sales. India’s automobile transition, therefore, is unlikely to follow a simple path from petrol to electric cars. It is becoming a more complicated mix of CNG, hybrid, battery-electric and conventional vehicles, shaped by price, running costs, infrastructure and how each vehicle is used.
August’s numbers offer the clearest sign yet that this transition has moved from being a niche trend to a mainstream consumer choice. For the first time, India’s car buyers collectively chose alternatives to petrol more often than petrol itself.
Climate
The Giant Steel Gates Guarding the Netherlands from the Sea
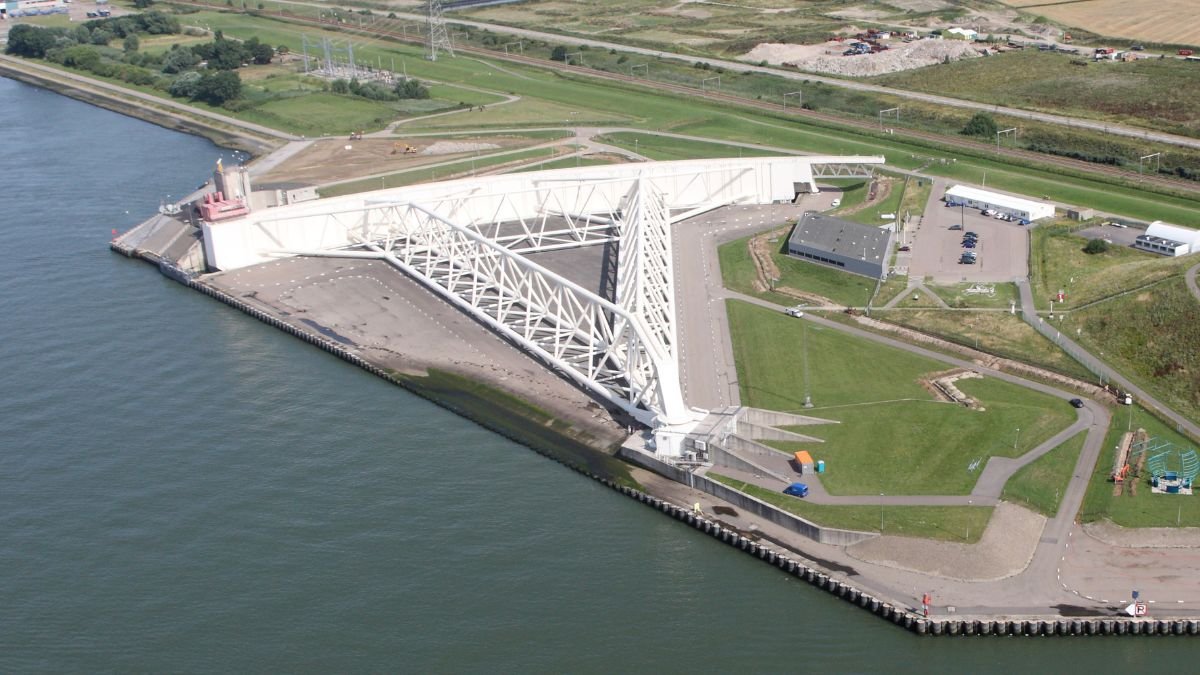
The Maeslantkering is the Netherlands’ giant movable flood barrier, protecting Rotterdam and South Holland while keeping one of Europe’s busiest ports open.



Digital Detox: Why Taking a Break From Screens Matters

When a Village Walks Together, Even Drought Is Defeated. How Halma Breathed Life Back into Kesarpura’s Pond

100% Access in China, 5% in South Sudan: The Global Electricity Gap

India to Push Indian Sign Language Into Everyday Life

Worms in Tuna? Why a Brazil Study Has Triggered an Indian Advisory

From Scams to Screens: How the National Stock Exchange Rewrote India’s Equity Story

Farmers Borrowed to Build ‘Diggis’. Two Years Later, They Are Still Waiting for the Subsidy

Aim for the Stars: Anjali Thomas’s Journey from a Small College in Kerala to the Frontiers of Medical Imaging

When the Himalayas Collapse Without Warning, What Counts as Preparedness?

Anxiety Freezes Career Decisions. Curiosity Unfreezes Them

-

 Math2 months ago
The 2026 Fields Medals: Four Proofs, Four Decades-Old Problems Solved
-
Climate2 months ago
After Kerala’s Deadliest Landslide, the Hardest Thing to Rebuild Was Childhood
-
Society3 months ago
West Asia Crisis: Can Kerala’s Returning Gulf Migrants Find a Future in the Green Economy?
-
Space & Physics4 months ago
India Semiconductor Mission: ‘It’s Not About Fabs. It’s About Building An Entire Ecosystem’
-
Interviews3 days ago
From Scams to Screens: How the National Stock Exchange Rewrote India’s Equity Story
-
Climate4 months ago
The Climate World Cup? How Climate Change Could Affect Player Performance at the 2026 World Cup
-
Society3 months ago
What Is Civilisational Diplomacy? Understanding India’s Newest Foreign Policy Tool
-
Society3 months ago
From Bell Labs to the Classroom: A Second Career in Teaching