
Climate
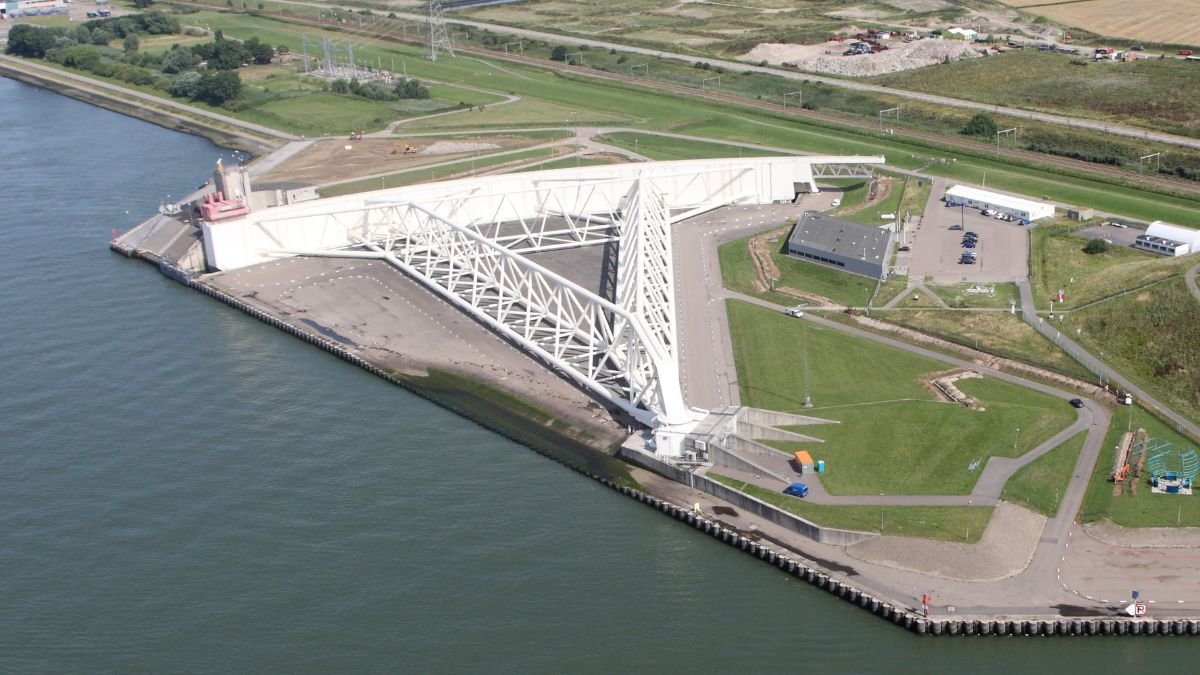
The Giant Steel Gates Guarding the Netherlands from the Sea
The Maeslantkering is the Netherlands’ giant movable flood barrier, protecting Rotterdam and South Holland while keeping one of Europe’s busiest ports open.












Climate
Kashmir’s Traditional Rice Varieties Hold Genetic Clues to Climate Resilience
A new study by SKUAST-Kashmir researchers identifies cold-tolerance genes in traditional rice varieties, highlighting their potential for climate-resilient crop breeding.

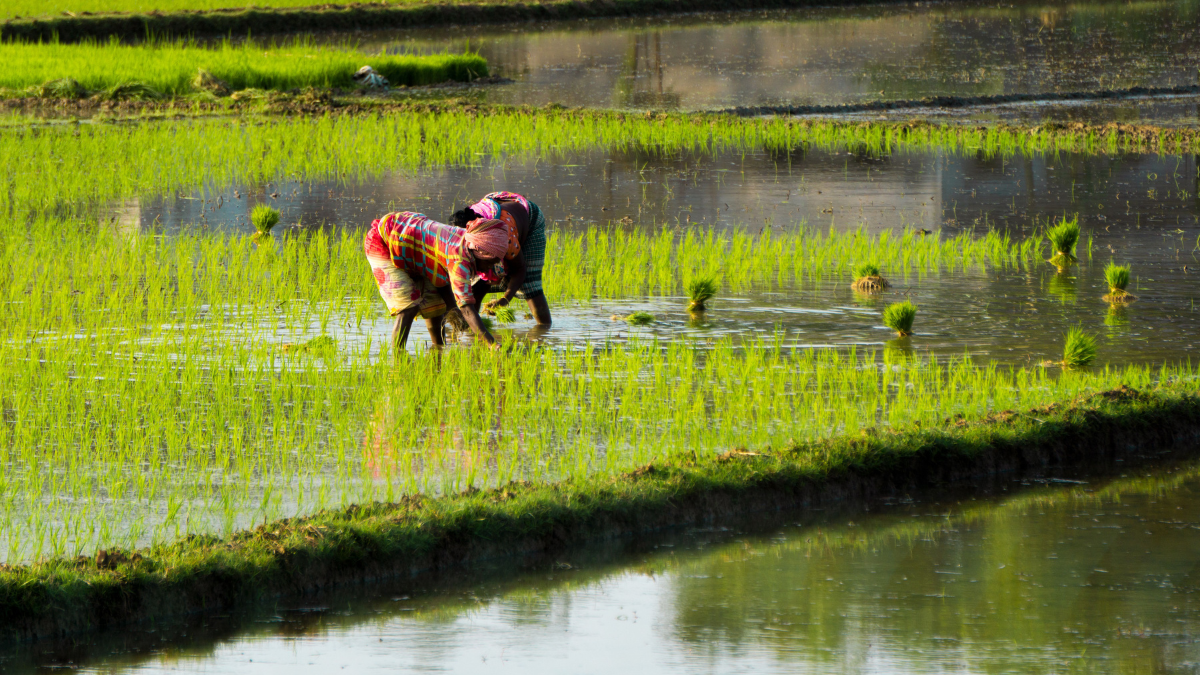
For generations, farmers in Kashmir have cultivated traditional varieties of rice adapted to the region’s distinctive growing conditions. A new genomic study has found that these varieties retain genetic characteristics associated with cold tolerance and local adaptation, potentially offering valuable resources for developing climate-resilient crops.
Researchers at the Sher-e-Kashmir University of Agricultural Sciences and Technology of Kashmir (SKUAST-Kashmir), Srinagar, analysed 142 rice germplasm samples to examine the genetic diversity and evolutionary history of rice cultivated in the region. Published in The Plant Genome in 2026, the study identified genetic signatures in traditional varieties that could help researchers develop rice better suited to environmental stress.
The findings are significant as climate change alters growing conditions and increases uncertainty for agricultural production. Preserving traditional crop varieties could give plant breeders access to genetic traits that may have become less common in modern cultivars.
Genes linked to cold tolerance
The study, titled Re-sequencing 142 rice genomes reveals the fine-scale population structure and phylogenetic affinities of landraces of Kashmir Valley: Evidence from domestication and adaptive signatures, used genomic analysis to investigate relationships among traditional landraces, modern varieties and other rice genetic resources.
The researchers found that Kashmir’s traditional varieties carried genetic signatures associated with temperate japonica rice, while many modern varieties showed stronger associations with indica lineages from subtropical India. This distinction points to differences in their genetic histories and adaptation to local growing environments.
Among the important findings was the identification of favourable variants of CTB4a and HAN1, two genes associated with cold tolerance in rice. The researchers also examined genetic variation linked to grain quality, plant development and other agricultural traits.
Traditional varieties, including Mushq Budji, Kamad, Kaw Kreer, Nun Beoul and Zag, displayed distinctive genetic patterns. Their diversity could provide useful material for future crop-improvement programmes.
The findings do not establish that all these varieties are more resilient than modern cultivars under every environmental condition. Instead, they identify genetic resources that warrant further investigation through breeding programmes and field trials.
Earlier research explains the significance
Previous research provides a scientific basis for investigating the cold-tolerance genes identified in Kashmir’s traditional rice varieties.
A 2017 study published in Nature Communications examined CTB4a, a gene associated with cold tolerance during the booting stage of rice development, when reproductive structures form. The researchers found that a favourable variant improved cold tolerance and helped maintain pollen fertility and seed setting under low-temperature conditions.
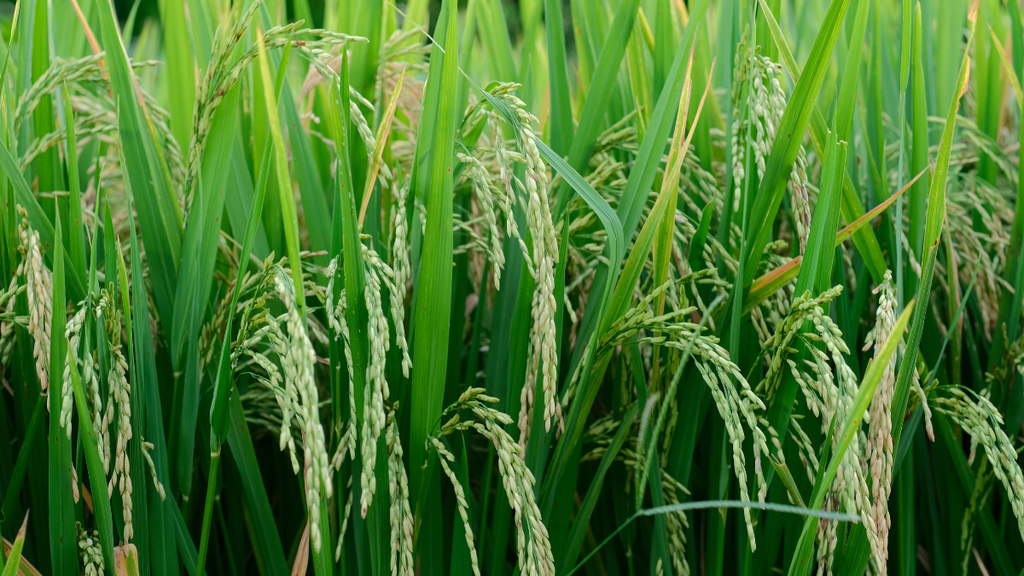
Crops in a paddy field.Image credit:Pexels
Similarly, a 2019 study published in the Proceedings of the National Academy of Sciences investigated HAN1 and found that natural genetic variation in the gene contributes to chilling tolerance in temperate japonica rice. The findings helped explain how rice adapted to cooler climates.
These studies strengthen the case for investigating CTB4a and HAN1 variants in Kashmir’s rice germplasm. However, the presence of promising genetic variants does not automatically guarantee improved performance in farmers’ fields. Their effects can depend on the crop’s broader genetic background, the timing and intensity of temperature stress, and other environmental conditions.
Conserving agricultural diversity
The Kashmir study also offers insights into the region’s agricultural history. Its genetic analysis suggests links between traditional Kashmir rice varieties and temperate rice lineages associated with Northeast Asia. The researchers propose that these lineages reached the region after approximately 1500 BCE, although this historical reconstruction remains an interpretation of genetic and archaeological evidence.
Beyond their historical significance, traditional rice varieties may preserve traits useful for future agricultural challenges. Modern breeding programmes often prioritise yield and other selected characteristics, but genetic diversity within traditional varieties can provide additional options for addressing environmental stress and maintaining grain quality.
The findings underline the importance of conserving traditional rice germplasm in gene banks and supporting its continued cultivation where feasible. Such conservation helps prevent potentially valuable genetic material from disappearing as farming systems and crop preferences change.
As climate change places increasing pressure on agricultural systems, Kashmir’s traditional rice varieties offer researchers a valuable starting point for investigating crop adaptation. Their genetic diversity connects generations of farming knowledge with modern genomic research, potentially helping plant breeders develop rice varieties suited to changing environmental conditions while preserving the region’s agricultural heritage.
Earth
India’s Green Cover Declined by 5.6 Percentage Points in 25 Years as Summer Heat Intensified: Study
A new study links India’s declining green cover to rising summer temperatures, highlighting the importance of vegetation conservation for climate adaptation.

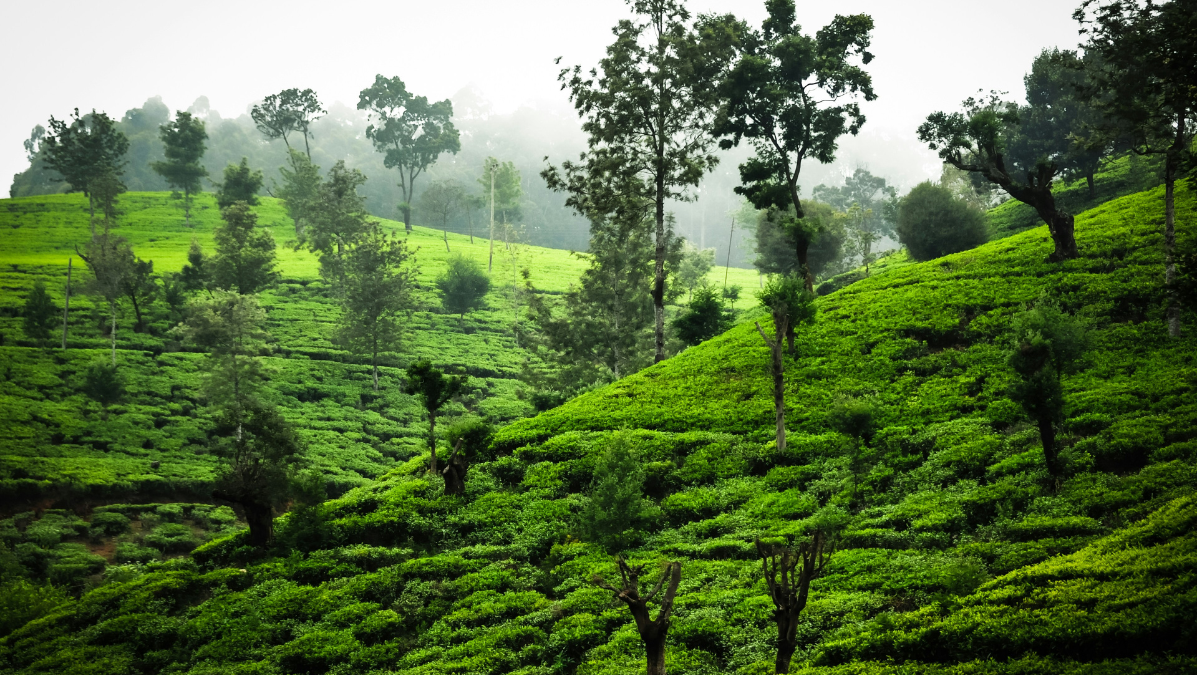
India’s green cover declined from approximately 36.95 per cent in 2001 to 31.35 per cent in 2025, while non-green surfaces expanded across the country, according to a new study by Climate Trends. The analysis found that non-green landscapes consistently recorded higher summer temperatures than vegetated areas, highlighting the role of green cover in moderating local heat.
The study, Assessment of Green Cover Dynamics and Their Influence on Summer Temperature across India Using MODIS Land Cover and ERA5 Reanalysis Data, found that the average summer temperature difference between green and non-green landscapes ranged from approximately 1°C to 2.5°C. Areas experiencing green-cover loss recorded a mean summer temperature increase of 0.26°C.
The findings suggest that vegetation loss can contribute to local warming, although the study also identifies broader regional climate change as a factor influencing temperature trends. Protecting and restoring vegetation could help reduce local thermal stress, but it cannot independently offset the effects of global warming.
“Vegetation is not merely an ecological asset; it is an important component of India’s climate-adaptation infrastructure,” said Dr Palak Balyan, Research Lead at Climate Trends.
The study comes amid growing concerns over extreme heat and its implications for public health, livelihoods and infrastructure. The India Meteorological Department reported that 2024 was the country’s warmest year since records began in 1901, with the annual mean temperature 0.65°C above the 1991–2020 average.
Vegetation Loss and the Local Heat Effect
The Climate Trends analysis used land-cover information from the Moderate Resolution Imaging Spectroradiometer (MODIS) and ERA5-Land temperature data to assess changes between 2001 and 2025. It examined summer conditions during March, April and May to understand how land-cover transitions corresponded with temperature patterns.
Vegetation helps regulate surface temperatures through shading and evapotranspiration, the process by which plants release water vapour into the atmosphere. Trees reduce the amount of solar radiation reaching the ground, while vegetation and soil moisture influence how energy is absorbed and released. When green landscapes are replaced by built-up areas, exposed ground or sparsely vegetated surfaces, these cooling mechanisms may weaken.
Dr Balyan said the persistent temperature difference between green and non-green landscapes demonstrated the importance of vegetation in regulating local thermal conditions.
“Protecting existing natural vegetation should therefore be treated as an adaptation priority, particularly in regions experiencing simultaneous green-cover loss and rising summer temperatures,” she said.
The findings are consistent with the Intergovernmental Panel on Climate Change’s assessment of nature-based cooling measures, which identifies urban trees, vegetation and green infrastructure as potential ways to reduce heat exposure. However, the extent of cooling depends on local climate, vegetation type, water availability and the surrounding built environment.
Regional Differences Require Targeted Action
The study found that green-cover loss was concentrated in parts of western India, the Indo-Gangetic Plain, central India and the peninsula. Localised gains were identified in portions of the northeastern states, the Himalayan foothills and scattered areas of southern and eastern India.
Temperature changes also varied geographically. Warming was particularly evident across northwestern and northern India, while localised cooling occurred in parts of central and southern India. These variations indicate that national averages can obscure differences in local land-use patterns and climate conditions.
The findings have implications for urban planning, particularly in rapidly expanding cities where construction can replace trees, open spaces and other vegetated landscapes. Protecting mature trees, retaining existing green spaces and integrating vegetation into streets and public areas could help reduce heat exposure, particularly in vulnerable neighbourhoods.
However, restoration must be planned around local ecological conditions. Newly planted trees cannot immediately provide the shade offered by mature canopies, and their survival depends on suitable species, soil conditions, water availability and long-term maintenance. Protecting established vegetation is therefore an important complement to new planting initiatives.
Green Cover Cannot Replace Broader Climate Action
The study emphasises that land-cover changes are not the only drivers of summer temperatures. Both green and non-green landscapes experienced warming during the study period, indicating the continuing influence of broader climatic conditions.
Dr S K Dhaka, Professor of Atmospheric Physics at the University of Delhi, cautioned against treating vegetation restoration as a standalone solution.
“Vegetation restoration can reduce local thermal stress, but it should not be viewed as a substitute for broader climate action,” he said.
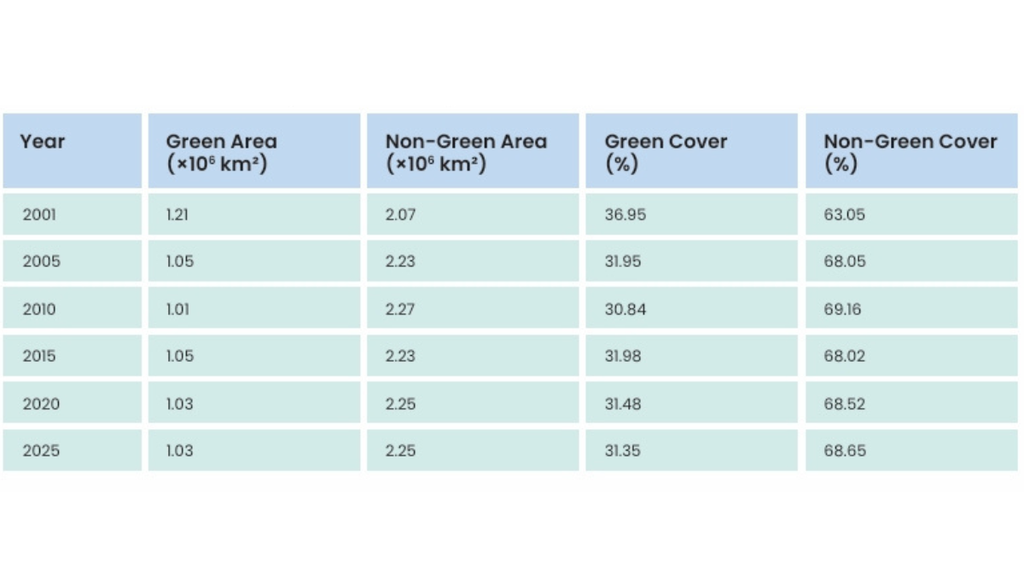
Temporal variation in green and non-green land cover across India
He added that warming observed even in areas that remained continuously green showed that large-scale climatic forces continued to influence regional temperatures.
“India therefore needs a dual strategy: prevent further loss of established vegetation while implementing scientifically targeted restoration in heat-vulnerable regions, alongside stronger action on water management, urban planning and greenhouse-gas emissions,” Dr Dhaka said.
The distinction is important because increasing vegetation alone cannot eliminate heat risks associated with rising background temperatures. Effective adaptation requires combining nature-based measures with emissions reduction, appropriate urban design and improved water management.
Aarti Khosla, Founder-Director of Climate Trends, said the study highlighted the practical consequences of losing vegetation.
“The study puts a number on something we’ve long argued, that vegetation is not a biodiversity afterthought, but a climate-adaptation infrastructure,” she said.
“Where green cover has disappeared, temperatures have risen with it, and that is a cost India’s communities are already paying for,” Khosla added.
She also pointed to international biodiversity commitments, including the target of restoring 30 per cent of degraded ecosystems by 2030, arguing that the gap between commitments and implementation has consequences for climate resilience.
The study recommends protecting existing vegetation, preventing avoidable green-cover loss and promoting ecological restoration as part of sustainable land management.
Its central message is that green cover should be considered more than an environmental amenity. While vegetation cannot prevent all forms of warming, conserving it can help moderate local temperatures and reduce thermal stress. As India faces increasing heat risks, integrating vegetation protection into climate adaptation and development planning could help build more resilient communities.
Climate
Europe’s 2026 Heatwaves Linked to More Than 32,000 Deaths, Study Estimates
Heat-related deaths in 854 European cities reached an estimated 50,391 in summer 2026, according to a new study. Malta, Italy and Hungary recorded the highest modelled mortality rates, while a severe June heatwave accounted for nearly one-third of the estimated toll.

Europe’s summer heat took an estimated 50,391 lives across 854 cities in 2026, with human-induced climate change contributing to nearly two-thirds of the heat-related deaths, according to a new study. The researchers estimate that 32,619 deaths—65% of the total—would not have occurred in the same way without the additional warming caused by human activities.
The findings point to a particularly heavy toll in southern Europe, where heat-related mortality rates were substantially higher than in the continent’s northern regions. Malta recorded the highest modelled rate, at 716 deaths per million people, followed by Italy at 561, Hungary at 537 and Croatia at 461.
The estimates cover June to August and are based on 854 cities across 30 countries, including the 27 European Union member states, the United Kingdom, Norway and Switzerland. These cities had a combined population of about 173 million in 2026, representing nearly 40% of the population across the countries studied. The figures therefore describe the burden in the cities covered by the research, rather than a complete count for Europe.
The scale of the estimated toll is striking against the backdrop of another exceptionally hot European summer. The Copernicus Climate Change Service ranked summer 2026 as the continent’s third warmest on record and the warmest on record in western Europe. The region’s seasonal mean temperature reached 21.69°C, which was 2.54°C above the 1991–2020 average.
Southern Europe Bears the Heaviest Mortality Burden
The study’s age-standardised estimates show a marked regional divide. Southern Europe recorded 380 heat-related excess deaths per million people, compared with 277 in western Europe, 250 in eastern Europe and 129 in northern Europe.
These rates account for differences in population age structure, making regional comparisons more meaningful. They also show why the number of deaths attributed to warming and the overall mortality rate should not be treated as interchangeable measures.
The proportion of heat-related deaths attributed to human-induced climate change was highest in Estonia and Bulgaria, at 81% in each, followed by Finland at 80%. Southern Europe’s estimated share was 69%, while northern Europe’s was 59%.
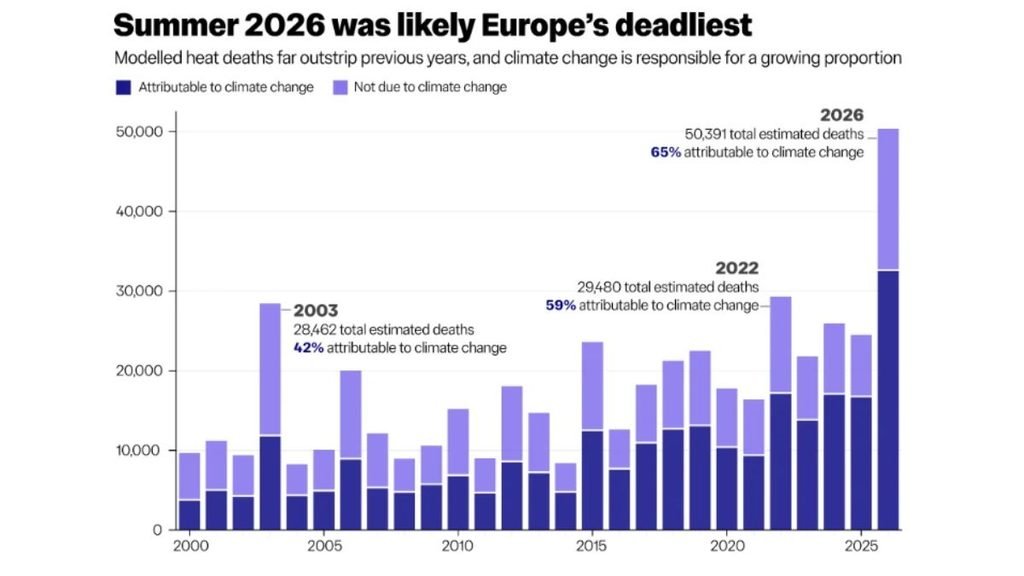
A high climate-attributable proportion does not necessarily mean a country had the highest heat mortality rate. The two measures answer different questions: how much heat-related mortality occurred, and how much of that burden can be attributed to human-caused warming. The researchers also caution that Malta’s estimate of the climate-attributable share carries considerable uncertainty.
Summer Heat: Deadly Fortnight in June
Nearly one-third of the estimated summer deaths occurred between June 17 and July 1, when the average daily mean temperature across the cities was 5.3°C above the 1991–2020 average. The study estimates that 57% of heat-related deaths during this period were attributable to human-induced climate change.
That share was lower than the 65% estimate for the summer as a whole. It does not mean climate change had little influence on the June heatwave. The researchers explain that the episode was so extreme that it would still have caused substantial harm even in a hypothetical climate without human-caused warming.
“I think we can be quite confident in stating that the summer of 2026 is likely to have been
the worst on record for heat-related mortality across much of Europe. These numbers are a
stark reminder that our hotter, more extreme summers are having an increasingly severe
impact on public health. Behind these statistics are real people whose lives were lost and
real families who grieve for them.
“It is yet another reminder both of the imperative of rolling out targeted interventions to protect those who are most vulnerable to this increasingly extreme heat, and of the growing need to rapidly transition away from fossil fuels to slow the pace of change and limit future warming.” said, Dr Clair Barnes, Extreme Weather and Climate Change Researcher at the Centre for Environmental Policy, Imperial College London
The city-wide average also conceals local extremes. The study found that the average daily temperature anomaly across the cities peaked at 7.3°C above normal, while some countries experienced days with temperatures as much as 12°C above their usual levels. Western Europe recorded an average summer temperature anomaly of 2.9°C, and southern Europe 2.6°C. The analysis also estimated 1,508 additional heat-related deaths between May 21 and May 31. These are reported separately from the headline June–August total.
Older People Face the Greatest Risk
Age was a major factor in the estimated mortality burden. People aged 85 and older accounted for 22,502 heat-related excess deaths—close to 45% of the summer total. By comparison, the estimated number among people aged 20 to 44 was about 833.
The toll was not confined to older adults. The study estimates that around 6,000 heat-related excess deaths occurred among people under 65, underscoring the risk faced by working-age adults as well as older residents.
Heat exposure can become especially dangerous when high daytime temperatures persist into the night, leaving the body with less opportunity to recover. The researchers note that the June episode involved high humidity and unusually warm nights, conditions that may have contributed to the health burden and could mean the model underestimated its effects.
The figures are statistical estimates of excess mortality, not a tally of death certificates naming heat or climate change as the cause. The researchers modelled the relationship between temperature and mortality, then estimated how many deaths were associated with observed temperatures and how that burden changed when the human-caused component of warming was removed.
Toll Higher Than Previous Benchmark Summers
Using the same group of 854 cities and the same analytical framework, the researchers estimated 29,480 heat-related excess deaths in summer 2022, 28,462 in 2003 and 24,572 in 2025. The 2026 estimate of 50,391 is substantially higher than each of those figures.
The comparison matters because estimates produced using different methods, time periods or geographical coverage can give misleading impressions of how mortality has changed. Applying a consistent framework to the same cities provides a more direct comparison, although the figures remain modelled estimates. National monitoring systems have also reported large mortality burdens during the 2026 heat episodes, but their estimates cannot be directly added to or compared with the study’s total.
In France, the national public health agency estimated at least 5,764 excess deaths from all causes during the June 17–July 2 heatwave across 92 departments covering 98.5% of mainland France’s population. Around two-thirds of those deaths were among people aged 75 and older. The measure captures excess deaths during the heatwave; it does not mean every death was individually certified as heat-related.
In England, the UK Health Security Agency estimated 2,124 heat-associated deaths during the June 21–28 heatwave and another 753 during a May episode, giving an interim combined estimate of 2,877. Germany’s Robert Koch Institute estimated around 16,000 heat-related excess deaths over a longer period, from April 6 to September 6, while Spain’s mortality monitoring system reported 5,123 excess deaths for June to August. Differences in coverage, time periods and methods mean these national figures should be read in their own context.
What the Estimates Can/Cannot Tell
To estimate the effect of climate change, the researchers compared observed temperatures with a counterfactual scenario in which the human-caused component of warming was removed. They then applied age-specific relationships between temperature and mortality, drawing on mortality data from 232 European Union cities covering 2000–2019, alongside population and mortality estimates for 2026.
The approach allows researchers to estimate the contribution of human-induced warming across many cities, but it has limitations. The underlying exposure–response data may not fully reflect changes in healthcare, adaptation, health conditions or vulnerability since 2019. The model also uses daily mean temperatures and assumes vulnerability remains constant throughout the year.
The study’s findings are therefore not a direct count of deaths that can individually be assigned to climate change. They are an estimate of how much the summer’s heat-related mortality burden changed because of human-caused warming.
Even with those qualifications, the size of the estimated toll raises practical questions for cities facing increasingly severe heat. Early warnings, accessible cooling spaces, support for older people and others at higher risk, and health services prepared for heat-related illness can help reduce exposure and its consequences. Cutting greenhouse gas emissions remains essential to limiting further warming, while public-health measures can help protect people from the heat already occurring.


Kashmir’s Traditional Rice Varieties Hold Genetic Clues to Climate Resilience

India Builds Synthetic Biology Capacity for Medicines and Industrial Production

India’s Green Cover Declined by 5.6 Percentage Points in 25 Years as Summer Heat Intensified: Study

Europe’s 2026 Heatwaves Linked to More Than 32,000 Deaths, Study Estimates

What Does Changing Western Disturbances Mean for Himalayan Rainfall?

Knowing When to Think for Ourselves: AI, Intuition and the Education of Discernment

After a Scorching Summer, Delhi’s Children Are Slow to Return Outdoors

Two Chemists Win Nobel Prize for Solving a Century-Old Puzzle: Why Life Picks One Hand Over the Other

Marshall Islands: Why the US Nuclear Legacy Is Back Before the UN

How Wind Turbines Could Produce More Power From the Same Wind

-

 Math3 months ago
The 2026 Fields Medals: Four Proofs, Four Decades-Old Problems Solved
-
EP Deep Dive: Data & Solutions3 months ago
After Kerala’s Deadliest Landslide, the Hardest Thing to Rebuild Was Childhood
-
EP Deep Dive: Data & Solutions4 months ago
West Asia Crisis: Can Kerala’s Returning Gulf Migrants Find a Future in the Green Economy?
-
Space & Physics5 months ago
India Semiconductor Mission: ‘It’s Not About Fabs. It’s About Building An Entire Ecosystem’
-
Interviews1 month ago
From Scams to Screens: How the National Stock Exchange Rewrote India’s Equity Story
-
Climate5 months ago
The Climate World Cup? How Climate Change Could Affect Player Performance at the 2026 World Cup
-
Society4 months ago
What Is Civilisational Diplomacy? Understanding India’s Newest Foreign Policy Tool
-
Society4 months ago
From Bell Labs to the Classroom: A Second Career in Teaching