
Earth
How India’s River Dolphins Navigate a Changing River System
India’s river dolphins are being counted again in 2026, as researchers assess populations and habitats after a 2021–23 survey estimated 6,327 dolphins across eight states. The findings could reveal how changing river conditions are affecting the species.


Dolphins recognise individuals, learn behaviours, remember information and communicate through a sophisticated repertoire of sounds. In some populations, they even use tools. These abilities have made dolphins one of the most closely studied animals in research on animal cognition. But “intelligent” is a broad description. Scientists studying dolphin cognition are asking more specific questions: How does a dolphin learn? What does it remember? How does it recognise another individual? How does it use information from its surroundings to make decisions?
Some of the clearest answers have come from bottlenose dolphins. They can develop individually distinctive signature whistles, learn behaviours socially and retain information about other dolphins. In Shark Bay, Australia, bottlenose dolphins have been observed using marine sponges while foraging, a behaviour that can be passed from mothers to calves.
The research tells us that dolphins are capable of sophisticated learning and social behaviour. It also raises a less familiar question for India: what happens to a species with such a complex relationship with its surroundings when those surroundings are changing?
India’s River Dolphins Live by Listening
The Ganges river dolphin has an unusual way of experiencing its habitat. It has extremely limited vision and depends heavily on echolocation. In the turbid waters of the Ganga and its tributaries, it sends out high-frequency clicks and interprets the returning echoes to locate prey and navigate. Its survival therefore depends on more than whether there is water in the river.
It needs suitable depth and flow, enough prey and stretches of habitat through which it can move. Dams and barrages can alter these conditions. Water extraction can reduce flows. Fishing can lead to accidental entanglement, while pollution can affect the aquatic food chain.
The river is also a working landscape for people. It supplies water, supports agriculture and fisheries, and is increasingly shaped by infrastructure. For the dolphin, those same interventions change the conditions under which it lives.
How Many Dolphins does India Have?
For the first time, India has a national baseline. A survey conducted between 2021 and 2023 covered more than 8,500 km of rivers across eight states and estimated 6,327 riverine dolphins. The overwhelming majority were Ganges river dolphins—6,324. Only three Indus river dolphins were recorded in the Beas River.
Uttar Pradesh and Bihar accounted for the largest populations. It is a count of riverine dolphins, not all dolphins found in Indian waters. India’s coast and estuaries support several marine and estuarine species, for which population information is less comprehensive.
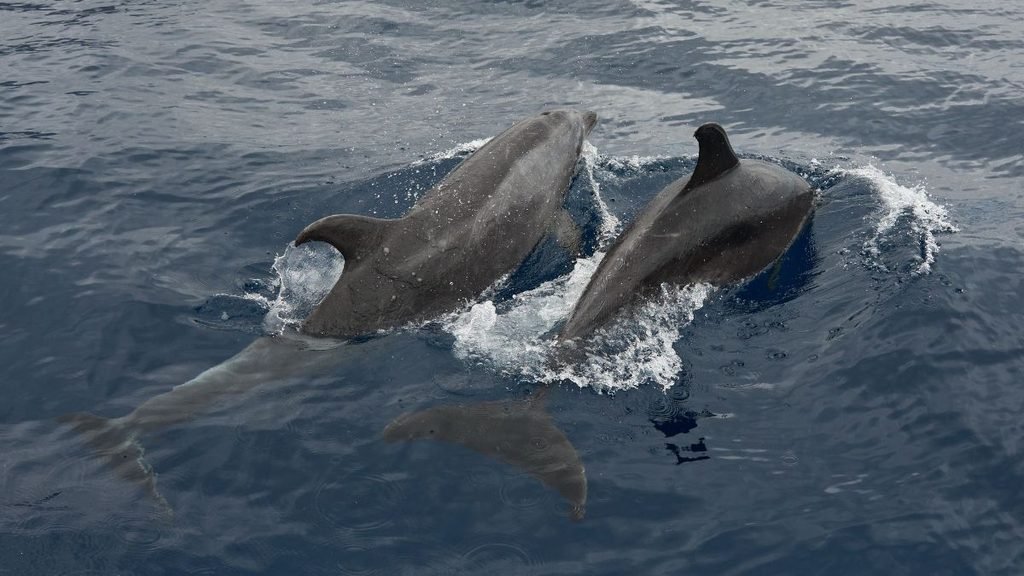
More importantly, a national total cannot show everything happening inside individual rivers. Two stretches of the same river can offer very different conditions for dolphins. A national population may therefore hide local changes in habitat, distribution or abundance. That is why India is counting them again.
The Second National Assessment is Underway
In January 2026, India began its second range-wide estimation of riverine and estuarine dolphins under Project Dolphin. The Wildlife Institute of India is coordinating the assessment with state forest departments and conservation organisations. The exercise includes Irrawaddy dolphins in the Sundarbans and Odisha, while researchers are also using underwater acoustic monitoring to detect dolphins through their sounds.
The value of a second survey is not simply that it will produce another number. It will allow researchers to compare populations and distribution with the earlier baseline and begin identifying where changes are occurring.
What Protects Dolphins Under Indian law?
The Wild Life (Protection) Act, 1972 provides the principal legal protection. The Ganges and Indus river dolphins are listed under Schedule I, which provides the highest level of protection under the Act. Hunting is prohibited except in circumstances specifically permitted by law.
The Ganges river dolphin was declared India’s National Aquatic Animal in 2009. In 2020, the government launched Project Dolphin, bringing riverine and marine dolphins under a dedicated conservation programme focused on population assessment, habitat protection, research and reducing threats.
Yet there is a gap between protecting a species and protecting the conditions it needs. A protected-species law can prohibit hunting. It cannot, by itself, determine how much water is diverted from a river, how a barrage affects connectivity or how fishing pressure is managed. Those decisions are made through several parts of India’s environmental and development policy.
What does the Number Reveal?
For a Ganges river dolphin, a healthy river is defined by measurable conditions: enough flow and depth to move through its habitat, sufficient prey to feed on, connected stretches of water and fewer risks from fishing gear and pollution.
That makes the 6,327-dolphin estimate more than a conservation headline. It is a baseline against which India can track whether those conditions are supporting or limiting dolphin populations. The second national assessment should show where populations are increasing, declining or shifting. The harder task will be linking those changes to what is happening in the rivers—changes in flow, habitat connectivity, prey availability, fishing pressure and pollution.
That is where dolphin conservation moves beyond counting. Protecting the species also means managing the river conditions on which its survival depends.










Earth
Kerala’s Biodiversity Records Are Going Digital. What Could That Change?
Kerala has prepared 1,034 People’s Biodiversity Registers to document local species, habitats and traditional ecological knowledge. As these records move into digital systems, the state is exploring how they can better support biodiversity planning.
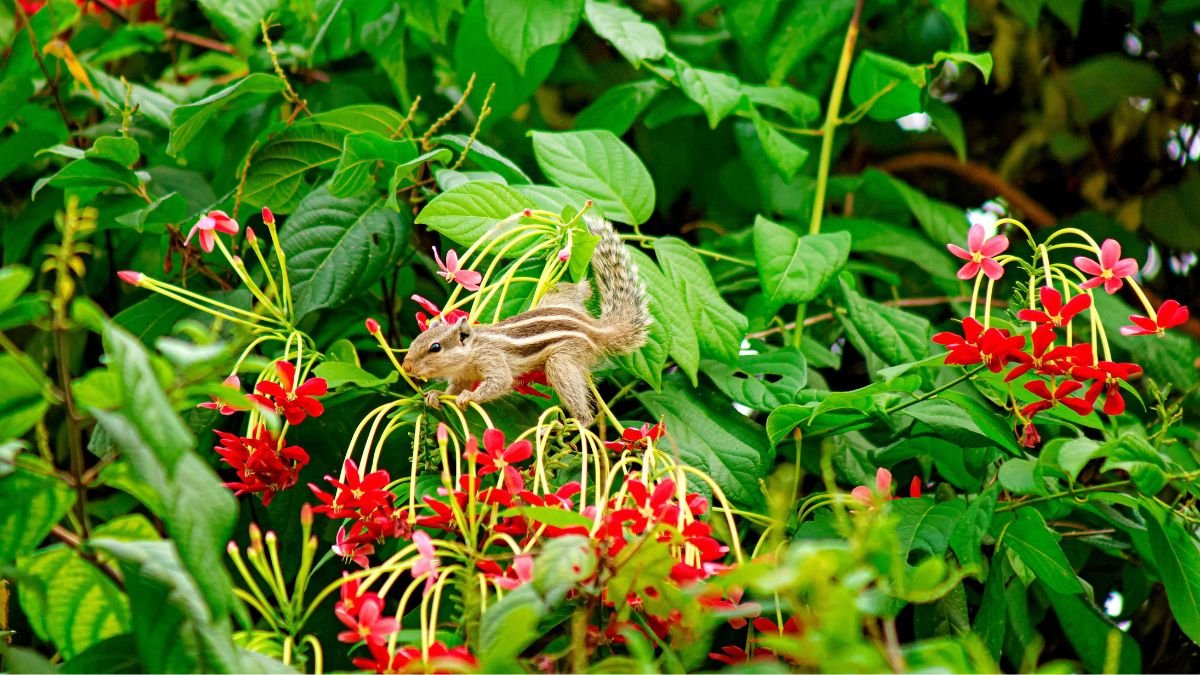
A farmer may remember a rice variety that disappeared from neighbouring fields. An older resident may know which fish once filled a local pond. A traditional practitioner may still know how a plant was used long before it appeared in a scientific database. Much of this knowledge remains with the people who live around these landscapes.
People’s Biodiversity Registers, or PBRs, were created to document it. Prepared with community participation through Biodiversity Management Committees, the registers record local plants, animals, crops, habitats and other biological resources, along with traditional knowledge about their uses and changes observed over time.
Kerala has spent years building this record. It has prepared 1,034 PBRs covering 941 grama panchayats, 87 municipalities and six corporations. Its network of Biodiversity Management Committees is larger, covering 1,200 local bodies. The state is now moving much of this information into digital systems.
From Paper Records to e-PBRs
Kerala was among the states involved in India’s early effort to develop electronic PBRs. In 2020, the National Biodiversity Authority and the National Informatics Centre worked on an e-PBR pilot involving Kerala, Goa, Tripura and Tamil Nadu.
For Kerala, the move builds on an extensive collection of paper registers. The state has worked with NIC to digitise its existing PBRs, while the national BIOMIS platform provides tools for creating and managing electronic registers.
An electronic register can do more than preserve the contents of a paper volume. Species records can be linked to locations, maps and observations. Information can be updated without creating an entirely new physical register. The system can also bring together information collected by different communities and local bodies.
BIOMIS includes features such as geotagging, maps, species information, knowledge holders and citizen observations. That could make the information considerably more useful for biodiversity planning, provided the records are kept current and properly verified.
National Database with Different Levels of Progress
India’s People’s Biodiversity Register programme has reached a substantial scale. The National Biodiversity Authority’s latest database lists 2,72,648 PBRs across the country. Uttar Pradesh accounts for 59,407, followed by Maharashtra with 28,649 and Madhya Pradesh with 23,557. Tamil Nadu has 13,604, Karnataka 6,554 and Kerala 1,034.
These numbers need some context. States differ considerably in the number and type of local bodies covered by their biodiversity programmes, so the number of PBRs alone does not provide a meaningful measure of progress.
Digitisation provides another view, but the figures come from a different database. BIOMIS, the electronic biodiversity-management system, records 13,600 of Tamil Nadu’s 13,600 entries as digitised, along with 14,080 of 14,083 for Andhra Pradesh, 3,376 of 3,416 for Odisha and 6,239 of 6,763 for Karnataka. For Kerala, BIOMIS lists 1,203 of 1,373 entries as digitised, or 87.62%.
The Kerala figures illustrate why the two databases should not be treated as interchangeable. The NBA database lists 1,034 PBRs for the state, while BIOMIS uses 1,373 as the base for its digitisation figures. The difference suggests that the systems are working with different datasets or categories of records. The BIOMIS percentage therefore indicates the status of records within that system; it cannot be used to say that 87.62% of Kerala’s 1,034 PBRs have been digitised.
For the same reason, the BIOMIS figures are better understood as indicators of digitisation within the electronic system, rather than as a ranking of states. The more important question is what happens to these records once they enter the system: whether they are updated, verified, linked to locations and observations, and eventually used in local biodiversity planning.
Why is PBR Important?
The value of a PBR lies in what it can capture that a conventional biodiversity survey may miss. A community may notice that a crop variety is disappearing long before the change appears in a wider agricultural database. Fishers can observe changes in a water body. Residents may know how a wetland, forest patch or stream has changed over decades. Traditional knowledge can also point to the food, medicinal or cultural uses of species that might otherwise remain poorly documented.
A PBR gives this knowledge a formal record. Repeated over time, the registers could also help track local ecological change. A species recorded in an earlier PBR but absent from a later one, for instance, could prompt questions about habitat loss, pollution, invasive species or changes in land use. That is particularly relevant in Kerala, where agricultural land, wetlands, forests and densely settled areas often exist within a short distance of one another. But the usefulness of the data depends on what happens after the register is prepared.
Keeping the Record Alive
The state has begun updating its existing PBRs and preparing Local Biodiversity Strategy and Action Plans. According to the Kerala Economic Review, 40 PBRs were updated in 2024–25. Twenty-eight BMCs were selected to prepare LBSAPs, of which 23 had completed them during the period. These efforts point towards a shift from simply recording biodiversity to using the information in local planning.
Whether that is happening widely is less clear. A PBR can document a disappearing crop, a declining species or a threatened habitat, but the information has little practical value if it is not updated, verified and considered when local decisions are made. India has already created a vast body of grassroots biodiversity records. Now, the test is whether those records become working data for the people and institutions responsible for managing the landscapes they describe?
Society
Under Lalbagh: How a Botanical Garden Forced Bengaluru to Rethink Its Tunnel Road
The Lalbagh tunnel road project has forced Bengaluru to rethink plans for a proposed tunnel through one of the city’s oldest and most important green spaces. EdPublica visits Lalbagh Botanical Garden and speaks to the people who walk through it every day. The Lalbagh tunnel road has become the clearest test yet of how far public pressure can move a government once a decision looks final.

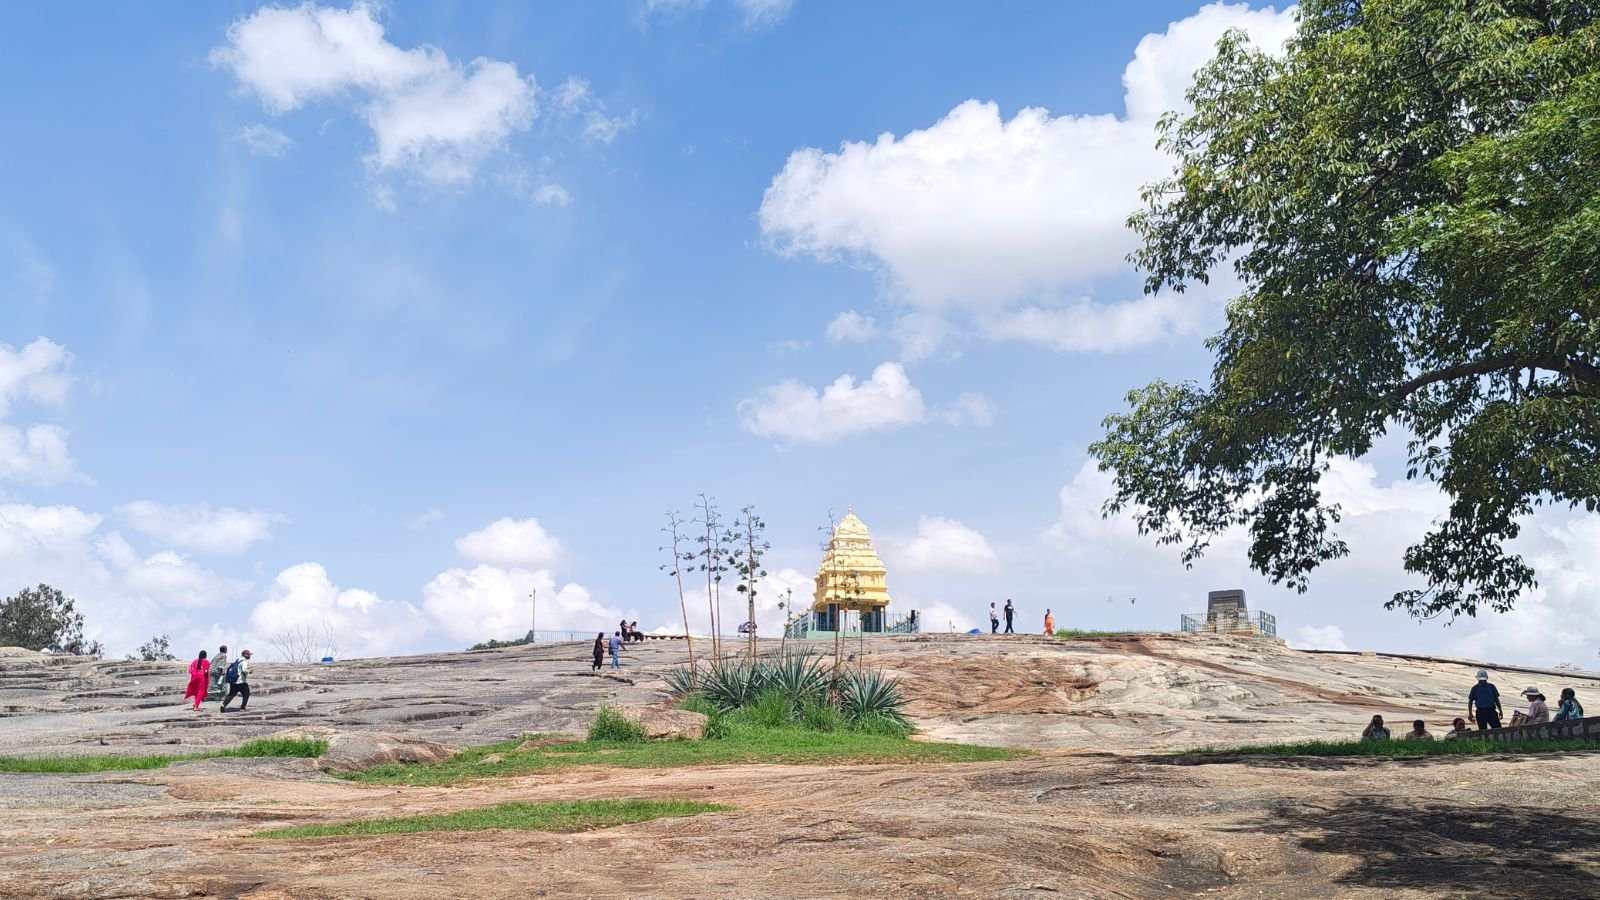
A Rs 17,000-crore-plus tunnel road was meant to cut Bengaluru’s commute times. Instead, it ran into a three-billion-year-old rock — and a government now scrambling to find another way through. EdPublica visits Lalbagh Botanical Garden and speaks to the people who walk through it every day.The Lalbagh tunnel road has become the clearest test yet of how far public pressure can move a government once a decision looks final.
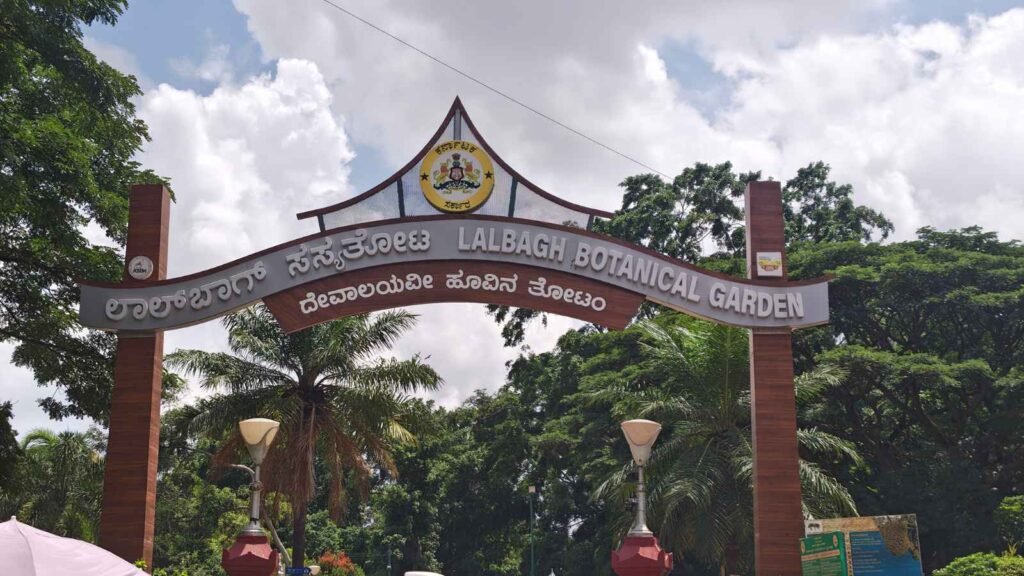
It is early morning at Lalbagh’s West Gate, and walkers are already streaming in — no ticket needed at this hour, the entry stays free until nine. Somewhere past the bougainvillea, the Rose Garden is waking up in the mist, and a flock of parakeets is making its usual racket around the glasshouse. For most of the people filing in, this is simply the start of another day — a walk, a stretch, a bit of quiet before Bengaluru’s traffic takes over. Few of them are thinking about what lies beneath their feet: a proposed ten-lane road tunnel that, on paper, was meant to run straight through this ground.
The autorickshaw driver who dropped this reporter near the gate had his own way of putting it. He’d seen the protest that filled the park on a Sunday morning not long ago — thousands of people, banners, a human chain stretching around the old rock. He didn’t have strong views either way about tunnels and traffic, he said, but he’d noticed something: when the government backed down on the law that triggered it all, and signalled it might route the project around the garden instead of under it, people he spoke to seemed relieved. Since then, he said, he’d been getting more fares to Lalbagh than usual — visitors curious, it seemed, about the garden that had been all over the news.
Rajendar, who lives in Jigani on the city’s southern edge and drives roughly ninety minutes to visit, put it more simply. He comes for the green, he said — for a couple of hours where the air feels different, away from the concrete and the horns. A garden like this, he felt, was not something the city had many more of to spare.
Credit: Dipin Damodharan/EdPublica
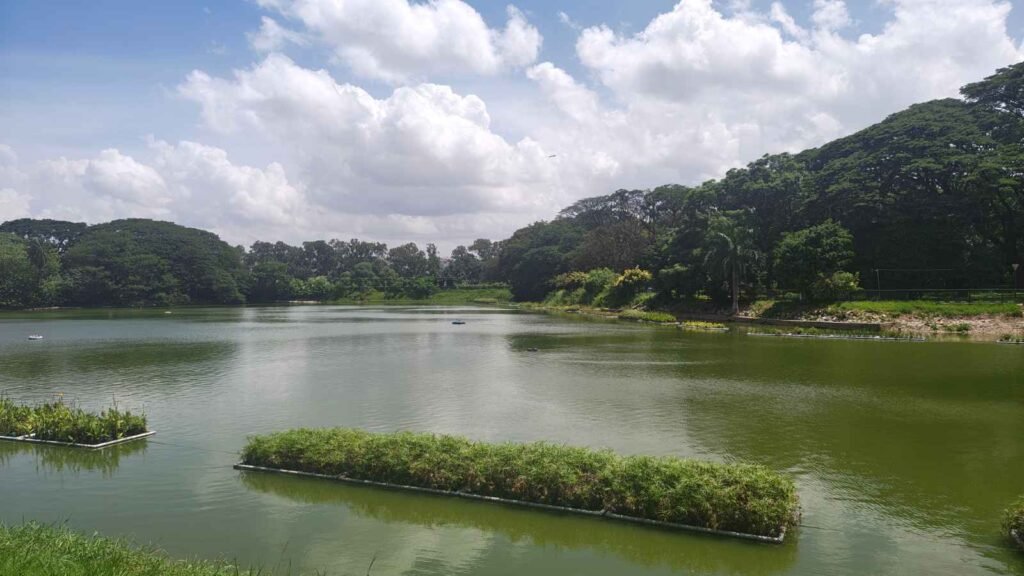
Not everyone was willing to be named. A corporate employee, mid-morning break, walking briskly along the lake path, agreed to talk only on condition of anonymity. His view was blunt: whatever the traffic problem is, running infrastructure like this under a garden like Lalbagh is not the way to solve it. The government, he said, needs to reconsider — and find a fix that doesn’t ask a 240-acre lung space to absorb the cost.
A garden older than the city’s traffic problem
Lalbagh’s story predates the automobile by more than a century. Hyder Ali, the ruler of Mysore, laid it out in 1760 as a private garden modelled partly on Mughal design; his son Tipu Sultan expanded it with plants brought back from campaigns and trading contacts across the region. British superintendents took over after, adding the glasshouse in 1890 — built, like much of the era’s civic architecture, in conscious echo of London’s Crystal Palace — and the garden has hosted its twin flower shows around Republic Day and Independence Day ever since.
Today it holds more than 1,850 plant species across 240 acres, including a roughly 250-year-old silk cotton tree said to date to Tipu Sultan’s time, and the Lalbagh Rock — a granite-gneiss outcrop now estimated by geologists to be about three billion years old, among the oldest exposed rock formations anywhere on the peninsula. A watchtower built during the reign of Kempegowda II sits on it. Campaigners have been pushing to have the rock considered for UNESCO recognition, in the same conversation as sites like Hampi.
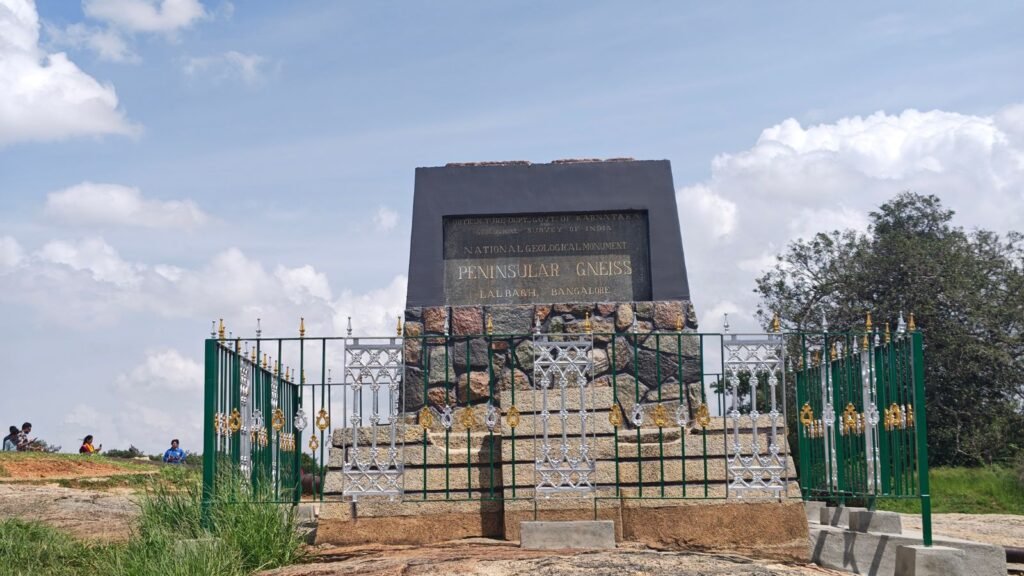
That rock, and the ground around it, is precisely what the tunnel road project has to pass through.
Lalbagh’s fight is, in that sense, a small and very local chapter of a much bigger story. UN-Habitat’s World Cities Report 2024 found that the average share of green space in cities worldwide fell from 19.5 per cent in 1990 to just 13.9 per cent by 2020 — and the decline has been sharper still in this part of the world, with East and Southeast Asia’s urban green cover dropping from 32.5 per cent to 18.6 per cent over the same period. Every city loses its green space to something that looks, at the time, like a reasonable trade-off — a road, a housing block, a transit line. Bengaluru’s version of that trade-off currently runs 50 to 100 feet under a botanical garden.
What the Lalbagh Tunnel Road Project actually proposes
The Bengaluru Tunnel Road — sometimes called the Twin Tunnel Road — is planned to run 16.5 to 16.75 kilometres between Hebbal in the north and Central Silk Board in the south, largely beneath the Outer Ring Road corridor. Its cost has been quoted at different points as roughly INR 17,000 crore, INR17,698 crore and, more recently, INR 22,267 crore, after Adani Group entities were reported to have won the contract. As originally designed, the alignment required roughly six acres of Lalbagh land — most of it temporary, during construction — for two entry and exit ramps and a ventilation shaft, with one ramp passing within a few hundred metres of Lalbagh Lake and another running close to the rock formation itself, at depths of 50 to 100 feet.
What the reports found
Three separate technical reports have shaped the debate, and none of them offer the government much comfort.
A Geotechnical Interpretative Report prepared for the city’s civic body by Rodic Consultants, dated September 2024, flagged the Lalbagh stretch as a “bedrock transition zone” and noted a geological lineament — a fault-like feature — crossing the proposed alignment near the lake, along with risks of groundwater seepage and seasonal water-table shifts.
A Geological Survey of India expert committee went further. Its report, submitted to the government in April 2026, warned that tunnelling and blasting near the rock could widen existing cracks, destabilise parts of the formation, and disturb groundwater flows into Lalbagh Lake — and separately flagged risk to the historic Kempegowda watchtower. GSI also noted civil-society efforts to have the rock nominated as a UNESCO site.
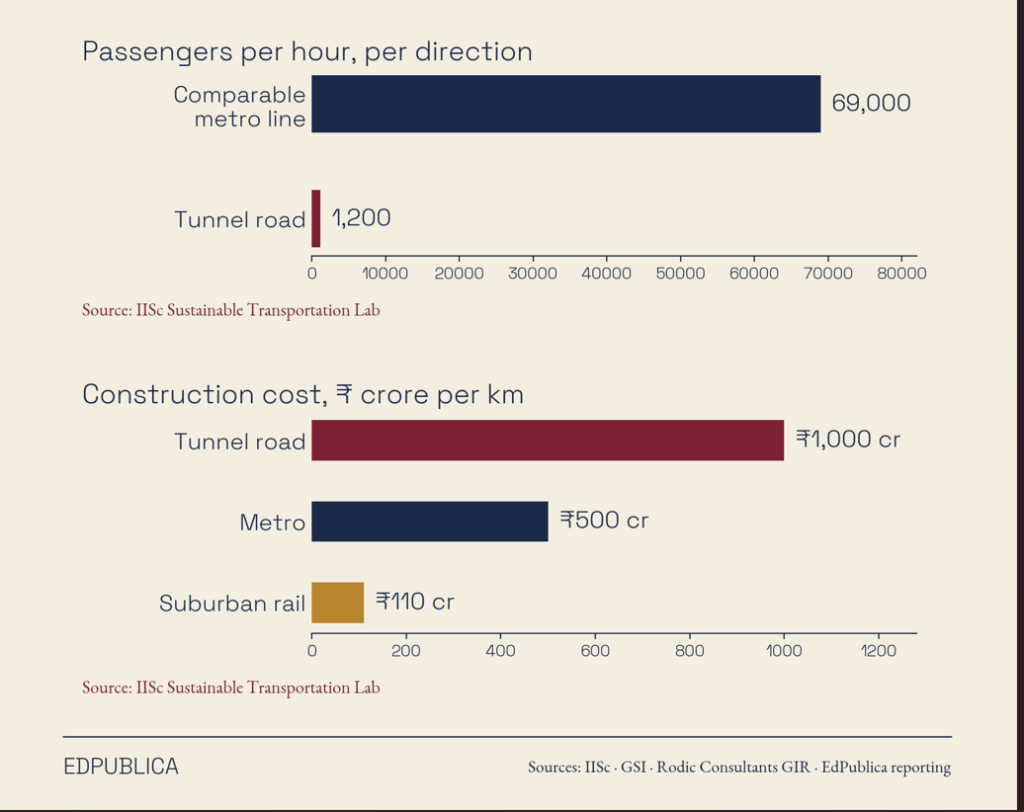
A third, independent study — by the Sustainable Transportation Lab at the Indian Institute of Science, led by Professor Ashish Verma — questioned the project’s basic logic rather than its geology. Modelling suggested the tunnel would carry only around 1,200 passengers per hour per direction, against roughly 69,000 for a nine-coach metro line built at comparable cost; in a high-toll scenario, the study projected the tunnel’s volume-to-capacity ratio could fall as low as 0.1 — a road built for far more traffic than would likely use it. The same analysis suggested the project could, in some scenarios, add to the city’s overall emissions rather than cut them, by drawing commuters away from mass transit and towards private cars.
The law that lit the fuse
If one thing turned this from a planning dispute into a street movement, it was a single piece of legislation.
The Karnataka Government Parks (Preservation) (Amendment) Bill, 2026, amends a 1975 law that has, until now, given government parks and gardens fairly strong statutory protection. The amendment inserts a new provision allowing the state to “alienate” — that is, sell, lease, gift, exchange, mortgage or otherwise transfer — up to 5 per cent of the total area of any government park or garden in Karnataka, for specified public infrastructure and utility projects. Applied to a 240-acre site like Lalbagh, that threshold works out to roughly 12 acres, twice what the tunnel’s original design was reported to need.
The government’s case is that the change is generic policy, not a Lalbagh-specific fix: Chief Minister D.K. Shivakumar has said it is meant to enable ordinary public works, such as road-widening, without the cost and delay of separately acquiring private land, and that the provision does not open parkland to private developers — land can only be leased, transferred or exchanged to government departments, statutory authorities and local bodies. Critics were not persuaded. The Bill was cleared by the Cabinet and passed by both Houses of the legislature on 24 August 2026 amid opposition protests inside the Assembly and, its critics say, with little substantive debate — timing that, coming as the tunnel’s alignment through Lalbagh was already under challenge in court, read to many as a legislative route around the garden’s protections rather than a coincidence.
How the fight unfolded
The reaction outside the legislature was faster than the government seemed to expect. Within three days of the Bill’s passage, more than 200 citizens, resident groups and environmental organisations gathered at Lalbagh on 27 August to form a human chain around the ancient rock, demanding the amendment be withdrawn. That Sunday, 30 August, the numbers swelled into the thousands for a march titled “Walk in Lalbagh, Walk for Lalbagh” — residents, walkers’ associations, cycling groups and pro-Kannada organisations alongside Bengaluru South MP Tejasvi Surya, Union Minister Shobha Karandlaje and other BJP lawmakers, plus veteran environmentalist A.N. Yellappa Reddy. Marchers sat and lay across the Peninsular Gneiss rock itself and raised slogans in Kannada and English with a common refrain: not one inch of Lalbagh.
The mobilisation built on opposition that had already been running for months through the courts — public-interest litigation in the Karnataka High Court led in part by theatre personality Prakash Belawadi and civic figures including Adikesavalu Ravindra and N.S. Mukunda, and an earlier, smaller human chain in early August aimed specifically at protecting the geological monument from the tunnel.
Facing that pressure, and with BJP leaders petitioning the Governor to withhold assent to the Bill, the state Cabinet withdrew it within days, on 3 September 2026. Shivakumar said the legislation would be reintroduced later, after wider public consultation — it has not been dropped for good. A week after that, on 9 September, he went a step further and said he had asked Greater Bengaluru Development Minister Krishna Byre Gowda to study alternatives to using Lalbagh land for the tunnel. That is an instruction to examine options, not a decision to reroute — no revised alignment has been published, and the original six-acre land requirement, the detailed project report and the tender awarded to Adani entities all remain officially in force.
Several petitioners have said they intend to keep challenging the project on transport and procedural grounds regardless of what happens to the amendment or the alignment. Their case — over the withheld 2025 expert report, the missing environmental impact assessment and questions about statutory transport-authority approvals — is due back before the Karnataka High Court in December.
Why the green matters, in numbers
- 240 acres — Lalbagh’s total area, one of the two largest green lungs in central Bengaluru alongside Cubbon Park.
- 1,850+ plant species recorded in the garden, built up over roughly 265 years by Mysore rulers, British superintendents and the state horticulture department.
- ~3 billion years — estimated age of the Lalbagh Rock, a Peninsular Gneiss formation and protected National Geological Monument.
- 16.5–16.75 km — length of the proposed tunnel road corridor between Hebbal and Silk Board.
- ~6 acres — Lalbagh land originally required for the tunnel’s ramps and ventilation shaft.
- 1,200 vs 69,000 — projected passengers-per-hour-per-direction for the tunnel versus a comparably priced metro line, per the IISc study.
- INR 1,000 crore/km — estimated tunnel construction cost, against roughly ₹500 crore/km for metro and INR 110 crore/km for suburban rail, by the same analysis.
A retreat, not a resolution
For now, the garden itself shows no sign of the fight above and around it. The lake is calm, the rock still draws its usual scatter of visitors reading the noticeboard about its age, and the morning walkers keep coming. What has shifted is something real but narrower than it looks: a government caught off guard by how fast a legislative manoeuvre turned into a mass protest, and forced into a public climbdown within ten days of passing a law.
That is not the same as Lalbagh being safe. The amendment is shelved, not repealed, and Shivakumar has said it will return after “consultation.” The instruction to study a route around the garden is exactly that — a study, with no published alternative and no change yet to the project’s land requirement, tender or contractor. The Geological Survey of India’s warnings about the rock, the watchtower and the groundwater, submitted in April and made public only in September, have not been formally answered. And the oldest thread of opposition — the court case over how the project was tendered and cleared in the first place — continues in December, indifferent to whichever way the alignment eventually bends.
So the honest answer, for Rajendar driving in from Jigani, or for the corporate employee unwilling to give his name, is not that they won. It is that a fight most people assumed was already lost turned out not to be — and that the next few months, in a courtroom and in a minister’s office rather than at a human chain, will decide whether that counts for anything.
Earth
Equal Earth: The Map That Shows the World at Its Actual Size
The world map most of us know does not accurately show the relative size of countries and continents. The Equal Earth projection offers a different way of representing the planet, preserving the relative area of landmasses and revealing just how much conventional maps distort our view of the world.
For most people, the world map is something so familiar that it rarely gets questioned. Africa sits roughly in the middle. Europe is above it. India is to the east. Greenland appears surprisingly large. Russia stretches across an enormous section of the northern hemisphere. But take the same countries and continents and put them on a globe, or on a map designed to preserve area, and the picture changes. This is the idea behind Equal Earth, a map projection designed to represent countries and continents according to their relative land area.
Greenland shrinks. Africa becomes much larger. Europe occupies far less space than many classroom maps suggest. The northern parts of the world lose some of the visual dominance they acquire on conventional maps.
The projection has gained new attention after the United Nations General Assembly backed a resolution encouraging the use of equal-area world maps. The resolution, led by Togo and supported by 164 countries, promotes Equal Earth as a more representative way of showing the size of the world’s landmasses. The important part of the story, however, is not that a new map has suddenly appeared. Equal Earth was created eight years ago. What has changed is the attention being given to the idea behind it.
Map: Round Earth Without Making Compromises
The Earth is roughly spherical. A conventional map is flat. That creates a problem that cartographers have dealt with for centuries: flattening a globe inevitably changes something. A map can preserve area, but distort shape. It can preserve direction, but distort size. It can attempt to balance several forms of distortion, but cannot eliminate all of them.
The famous Mercator projection is a good example. Developed by Gerardus Mercator in 1569, it was designed primarily for navigation. Its great advantage was that it preserved angles and made it easier for sailors to plot courses using compass bearings. It was not designed to show the relative size of countries. Yet the projection became one of the most familiar representations of the world.
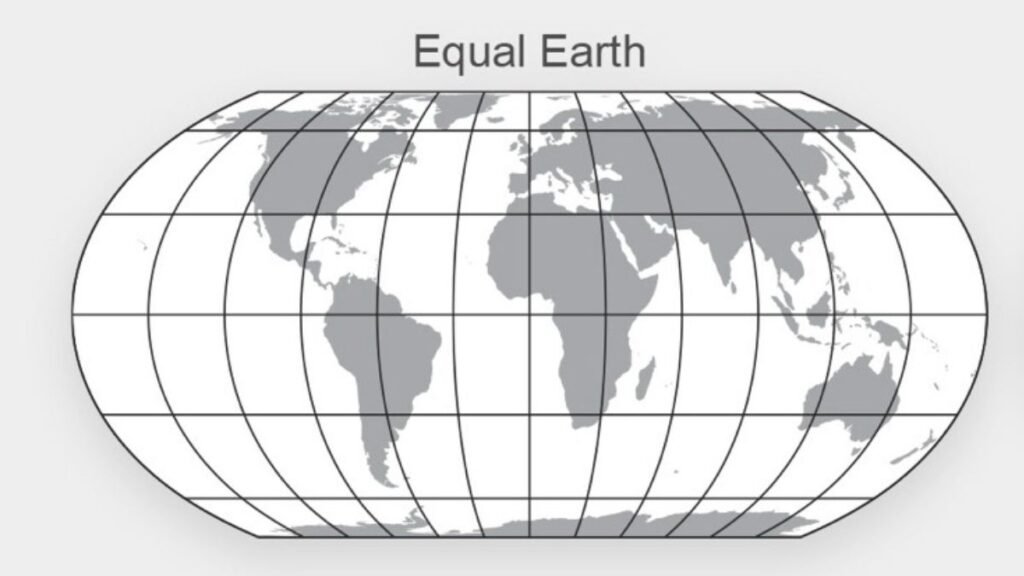
That creates some striking visual differences. On a Mercator map, areas become increasingly enlarged towards the poles. Greenland therefore appears vastly larger than it really is relative to Africa. In reality, Africa covers about 30.4 million square kilometres, while Greenland covers about 2.2 million square kilometres. Africa is roughly 14 times larger.
A map cannot change that geographical fact. But the projection used to draw it can make the difference difficult to see.
Equal Earth Starts With a Different Question
Instead of asking how to preserve direction, Equal Earth asks a different question: What if the area occupied by a country on the map should correspond to its actual area on Earth? That is what makes it an equal-area projection.
Equal Earth was introduced in 2018 by cartographers Bojan Šavrič, Tom Patterson and Bernhard Jenny. Their objective was to create an equal-area world map that was also visually balanced and suitable for general use. The projection was inspired partly by the Robinson projection, but unlike Robinson, it preserves the relative size of areas. The result looks familiar enough to be recognisable as a world map, but the proportions are different. Africa gets the space its area deserves.
South America appears considerably larger relative to Europe. India and other countries at lower latitudes no longer look as small compared with countries farther north. Greenland is no longer visually comparable with Africa. It stops making Africa look smaller.
What Does “Equal Area” Actually Mean?
It does not mean every country is made the same size.
“Equal” in Equal Earth refers to the preservation of area, not equality between countries. If Country A has twice the land area of Country B, an equal-area projection will preserve that relationship on the map. This becomes particularly useful when maps are being used to compare geographical phenomena.
An equal-area projection prevents the map itself from exaggerating some regions simply because of where they are located on the globe.
Why Does Africa Look So Different?
Africa is at the centre of much of the current discussion because the continent is particularly affected by the distortion of the Mercator projection. Most of Africa lies closer to the equator than Europe, North America and Russia. The farther north or south one moves from the equator, the greater the enlargement becomes on a Mercator map.
As a result, northern countries and territories occupy disproportionately large areas on the map, while Africa appears comparatively compressed.
Mercator’s projection was created for navigation in the 16th century. Its distortions are a consequence of the mathematical properties that make it useful for that purpose. But once a particular map becomes the dominant image of the world, its visual effects can influence how people understand geographical scale. That is one reason the Equal Earth debate has moved beyond cartography.
Map Can Influence How We Imagine the Planet
A student looking at a world map may not know the actual area of Africa, Greenland or South America. The map becomes the reference point. If Greenland looks almost as large as Africa, the brain absorbs that relationship before a textbook provides the numbers. This is why the choice of projection matters in education.
An equal-area map does not necessarily provide a more useful map for every lesson. But when the lesson is about how much land exists where, preserving area becomes important. The same principle applies to news graphics.
A map showing global temperatures, deforestation or agricultural production can communicate a very different impression depending on the projection used. The projection is therefore part of the information being presented, even when the audience never notices it.
Not a Perfect Picture of Earth either
There is an important misconception to avoid. Equal Earth does not eliminate distortion. No flat map can. Because the Earth is curved, every projection has to compromise somewhere. Equal Earth preserves area, but shapes and distances are not perfectly preserved. That is why cartographers use different projections for different purposes. A navigation chart may benefit from Mercator.
A map comparing the size of continents may benefit from Equal Earth. A map intended to show a general visual impression of the world may use another projection altogether. There is no single map that is mathematically perfect for every purpose.
Why the UN’s Decision Matters
The UN resolution does not legally abolish the Mercator projection. It encourages countries, educational institutions and organisations to consider equal-area alternatives, particularly Equal Earth. The resolution is therefore better understood as a recommendation about representation rather than a global cartographic mandate.
The vote also reflects a broader argument about how geographical knowledge is presented.
Togo and other African countries have argued that the familiar world map does not adequately communicate the actual scale of Africa. The campaign has therefore connected cartographic accuracy with representation and the legacy of how the world has historically been depicted.
The debate is not really about whether Africa should be made to look bigger. It is about whether a map used to teach and communicate geography should give viewers a reasonably accurate impression of the relative size of the world’s landmasses. The next time you see a world map, it is worth asking one question before reading it: What does this map preserve?


How India’s River Dolphins Navigate a Changing River System

From Scams to Screens: How the National Stock Exchange Rewrote India’s Equity Story

Could a cellular barcode reveal where ageing is happening?

The Scientist Who Changed the Way We Understand Childhood

What is AGI? AI’s Next Era: When Machines Start Taking on the Work

Farmers Borrowed to Build ‘Diggis’. Two Years Later, They Are Still Waiting for the Subsidy

When the Himalayas Collapse Without Warning, What Counts as Preparedness?

Anxiety Freezes Career Decisions. Curiosity Unfreezes Them

Meteorite Dust Reveals Evidence of Magnetic Field in the Young Solar System

The Engineer of Tomorrow Is Already Here

-

 Math2 months ago
The 2026 Fields Medals: Four Proofs, Four Decades-Old Problems Solved
-
Climate2 months ago
After Kerala’s Deadliest Landslide, the Hardest Thing to Rebuild Was Childhood
-
Society3 months ago
West Asia Crisis: Can Kerala’s Returning Gulf Migrants Find a Future in the Green Economy?
-
Space & Physics4 months ago
India Semiconductor Mission: ‘It’s Not About Fabs. It’s About Building An Entire Ecosystem’
-
Climate4 months ago
The Climate World Cup? How Climate Change Could Affect Player Performance at the 2026 World Cup
-
Society2 months ago
What Is Civilisational Diplomacy? Understanding India’s Newest Foreign Policy Tool
-
Society3 months ago
From Bell Labs to the Classroom: A Second Career in Teaching
-
Space & Physics4 months ago
Engineers Develop Dual-Mode Propulsion System for Next-Generation Small Satellites