
Climate
From Lost Wages to Rising Medical Bills: How Extreme Heat Is Already Costing India’s Economy

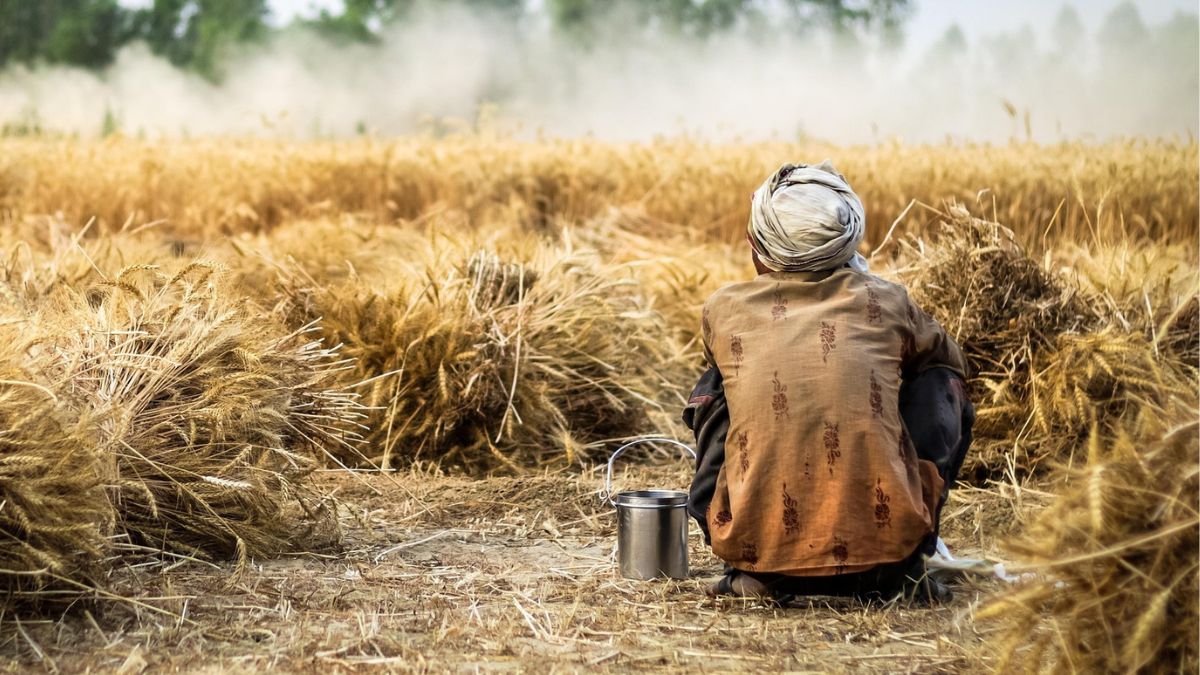
India’s scorching summer may have ended with the arrival of the southwest monsoon, but the economic impact of months of extreme heat is only beginning to surface. The costs are visible at every level—from workers earning less because they cannot stay on the job, to households paying more for healthcare and cooling, and ultimately to the country’s economy losing billions in productivity.
New report by Adelphi Global argues that this “double burden” of falling incomes and rising medical expenses is one of the least recognized economic consequences of climate change. In a country where nearly nine out of ten workers are employed in the informal sector and households continue to shoulder a large share of healthcare costs, the financial consequences are particularly severe.
When Heat Cuts Working Hours, Incomes Fall
Extreme heat affects the economy first through labour. Unlike machines, people cannot continue working safely under prolonged exposure to high temperatures. Workers slow down, take frequent breaks or stop working altogether to avoid heat stress. Recovery from heat-related illnesses can take weeks, while severe cases may permanently reduce a person’s ability to work.

The impact is greatest in agriculture and construction, where work is physically demanding and carried out outdoors. According to the report, India already loses an average of 4.31% of annual working hours because of this. Under a moderate warming scenario, that could rise to 5.8% by 2030. In agriculture and construction, annual working-hour losses are projected to reach 9.04%, equivalent to nearly 22.5 working days each year.
For millions of workers paid by the day, fewer hours on the job mean less money taken home.
Informal Workers With Little Financial Protection
The losses are particularly severe because most Indian workers lack social protection. The report estimates that 90% of women workers and 86% of men work in the informal economy, where paid leave, health insurance and wage protection are rare. Missing work because of extreme heat often means losing income immediately.
Median daily earnings remain modest even before these disruptions. Women earn about USD 18.72 (PPP) per day, while men earn around USD 25.52 (PPP). Repeated income losses can quickly push vulnerable households deeper into financial distress.
The report warns that between 54% and 80% of informal workers globally already earn below median wages. In India, where nearly one-fourth of the population lives below the World Bank’s lower-middle-income poverty line, recurring heat-related work losses could push even more families into poverty.
Rising Temperatures Raising Household Expenses
The financial impact does not stop when workers leave the job site. Heat-related illnesses increase medical spending at a time when incomes are already falling. Although public spending on healthcare has increased, households still pay 44% of India’s total health expenditure directly from their own pockets.
Annual per capita out-of-pocket health expenditure reached USD 151 (PPP) in 2023—almost three times higher than in 2000. Extreme heat also raises everyday living costs.
Keeping homes cool becomes more expensive during hotter months. While wealthier households spend only around 0.2–0.25% of their total expenditure on air-conditioning, the poorest households may spend up to 8% of their household budget on electricity for cooling. Researchers describe this growing financial burden as “heat poverty”—where families struggle to afford adequate cooling despite rising temperatures.
Due to this, food prices are also expected to rise. Higher temperatures alone could increase global headline inflation by up to 1.18% and food inflation by as much as 3.23% by 2035. Together, these costs create a financial squeeze: households earn less while spending more.
The Bigger Economic Picture
The report argues that these household-level losses eventually add up to a national economic challenge. According to Lancet Countdown, India lost about USD 194 billion in potential income because of reduced labour capacity caused by extreme heat in 2024. That is equivalent to roughly 5% of the country’s GDP.
Globally, the economic impact is equally significant. Between 1981 and 2010, heat exposure resulted in the equivalent loss of 35 million full-time jobs and reduced global GDP by an estimated USD 280 billion. Between 1992 and 2013, climate-driven extreme heat caused economic losses estimated at USD 16–50 trillion worldwide.
The findings show that extreme heat is no longer only an environmental or public health concern. It is becoming a growing economic challenge, particularly for labour-intensive economies like India.
Rising Heat: Need for Economic Policy
Adapting to extreme heat requires more than emergency weather advisories.
It calls for stronger labour protections, income support for workers affected by heat, expanded social protection for informal workers and greater public investment in healthcare to reduce dependence on out-of-pocket spending. It also recommends increasing adaptation finance to address productivity losses and the economic consequences of heat-related illnesses.
As climate change makes India’s summers hotter and longer, the true cost of extreme heat will be reflected in shrinking pay packets, rising household expenses and slower economic growth.








Climate
Climate Disasters Disrupted Schooling for 171 Million Students in 2025, UNICEF Finds
Climate disasters disrupted schooling for 171 million students worldwide in 2025, highlighting the urgent need for climate-resilient schools and education systems.
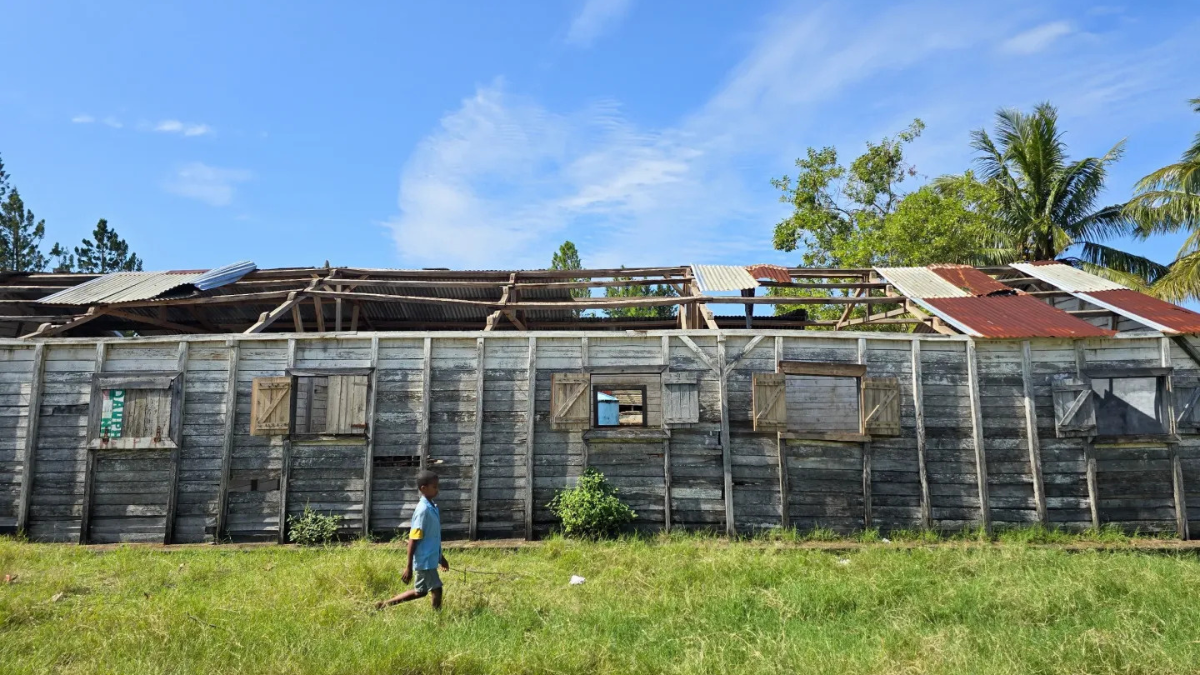
Climate-related disasters disrupted schooling for at least 171 million students worldwide in 2025, affecting one in every 10 school-age children, according to a new UNICEF report that warns of growing threats to learning, educational equality and future economic prospects.
The report, Learning Interrupted: Global Snapshot of Climate-Related School Disruptions in 2025, released on September 10, analysed data from 106 countries and territories. It found that storms, floods, heatwaves, droughts and wildfires caused school closures, shortened teaching hours, reduced attendance and shifts to remote learning.
The findings underline how climate change is emerging as a threat to educational continuity, particularly in countries where schools lack the infrastructure and resources to withstand extreme weather.
Storms and floods interrupt learning
Storms were the leading cause of climate-related school disruptions in 2025, affecting 109 million students globally. Floods affected at least 70 million, while heatwaves disrupted schooling for approximately 50 million children. These figures overlap and should not be added together as separate groups.
In Pakistan, severe monsoon flooding in August delayed the return to school for more than 28 million students. In Egypt, a powerful Khamsin wind-and-dust storm prompted a nationwide suspension of classes for one day, affecting more than 28 million students.
The problem extends beyond individual disasters. Forty countries experienced multiple rounds of climate-related school disruptions during 2025, exposing students to repeated interruptions throughout the academic year.
Floods can damage classrooms, sanitation facilities and learning materials, while extreme heat can make classrooms unsafe and undermine students’ ability to concentrate. Even after schools reopen, damaged infrastructure, disrupted transport and household financial pressures can prevent children from returning to regular attendance.
A growing threat to educational equality
Three-quarters of the students affected in 2025 lived in low- and lower-middle-income countries, where education systems often have fewer resources to prepare for disasters and restore teaching afterwards, UNICEF found.
The World Bank’s 2024 report, Choosing Our Future: Education for Climate Action, offers further evidence of the long-term challenge. It estimated that 400 million students globally experienced school closures due to extreme weather between 2022 and 2024. In affected schools in low-income countries, students lost approximately 45 instructional days between January 2022 and June 2024, compared with around six days in high-income countries.
These interruptions can compound existing educational disadvantages. Students from wealthier households may have access to private tutoring, digital devices and alternative learning arrangements. Children from poorer households may lack internet connectivity, electricity or suitable spaces to study during closures.
South Asia’s exposure highlights the challenge
UNICEF’s previous assessment, covering 2024, recorded at least 242 million students experiencing climate-related school disruptions across 85 countries and territories. South Asia was the most affected region, with 128 million students impacted. Heatwaves affected an estimated 171 million students worldwide that year.
India was among the countries affected by heat-related educational disruptions. In April 2024, extreme heat contributed to school interruptions across Bangladesh, Cambodia, India, the Philippines and Thailand, affecting at least 118 million children collectively. The figure represents the five-country group, not India alone.
The 2024 and 2025 totals should not be interpreted as a direct year-on-year decline. The reports covered different sets of countries and climate events, and the number of recorded disruptions depends on the incidents identified in each assessment.
Climate-resilient schools become a priority
UNICEF estimates that disruptions experienced in 2025 could cost affected students at least US$200 billion in lifetime earnings through lost learning and widening educational inequalities. This is a projection of potential future losses, rather than income already lost.
The World Bank has argued that relatively modest investments can help schools adapt. Its 2024 analysis estimated that a one-time investment of US$18.51 per child could help mitigate learning losses through measures such as improving classroom temperatures, strengthening school infrastructure and training teachers.
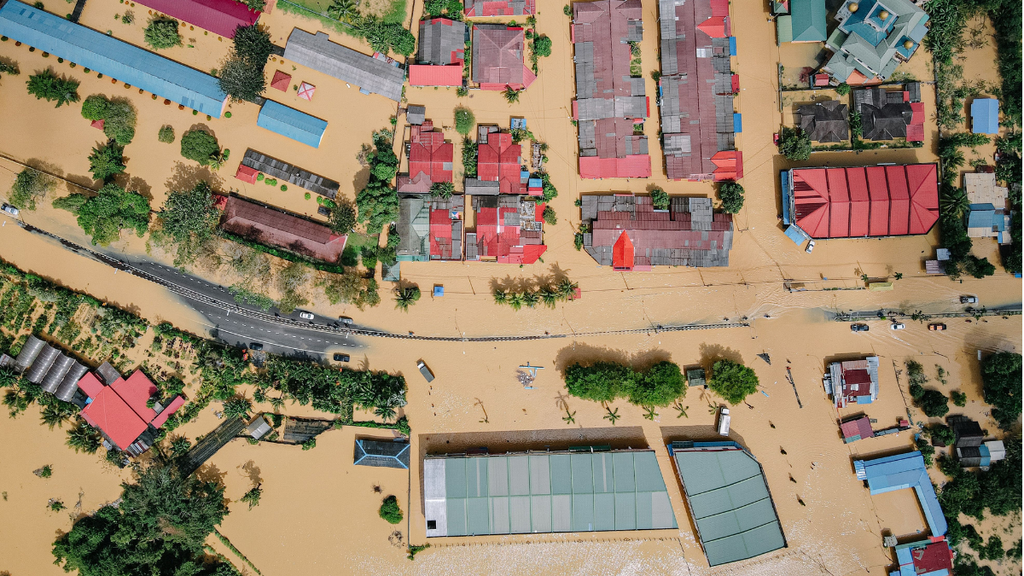
Aerial view showing significant flood damage in a residential neighborhood with inundated streets and homes.Image credit:Pexels
UNICEF is calling for climate resilience to be incorporated into education planning, alongside investment in stronger school buildings, emergency preparedness and systems that allow teaching to continue during disasters.
As extreme weather increasingly interrupts academic calendars, education systems must prepare not only to enrol children but also to protect their ability to learn. Climate-resilient infrastructure, early-warning systems and plans for educational continuity will be essential to ensuring that disasters do not deepen existing inequalities in access to education.
Climate
India Scores Just 2 Out of 32 for Integrating Health into Climate Commitments
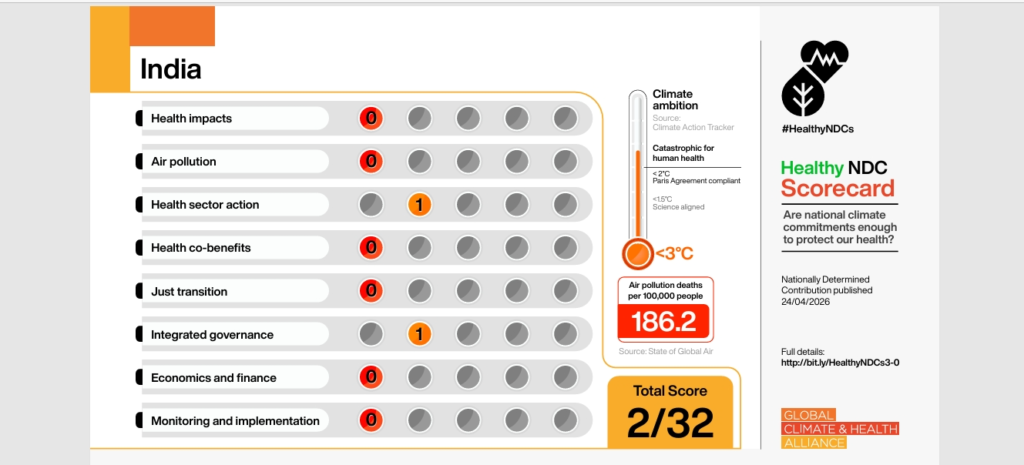
India has scored just 2 out of 32 in a global assessment of how national climate commitments integrate public health. The 2026 Healthy NDC Scorecard highlights gaps in India’s approach to air pollution, climate-related health risks and the implementation of health-focused climate action.


India has scored just two out of a possible 32 points for integrating health into its climate commitments, placing it among the lowest-performing countries in a new global assessment of national climate plans. The findings highlight a significant gap between climate policy and public health in a country grappling with severe air pollution and growing exposure to climate-related hazards.
The Healthy NDC Scorecard, published on October 14 by the Global Climate and Health Alliance (GCHA), assessed the climate plans of 132 countries that submitted their 2035 commitments to the United Nations Framework Convention on Climate Change before August 1, 2026. Nationally Determined Contributions (NDCs) outline the climate actions countries intend to undertake under the Paris Agreement.
India’s score of 2 out of 32 indicates that its latest climate commitment does not adequately recognise the connections between climate change, air quality and human health. Japan and New Zealand received the same score, placing all three among the lowest-scoring countries in the assessment.
The findings are particularly significant for India because the country continues to face a substantial burden of air-pollution-related deaths. The scorecard cites State of Global Air data indicating 186.2 air-pollution deaths per 100,000 people in India, underscoring the scale of the public health challenge.
Health missing from climate planning
The scorecard evaluates national climate commitments across eight categories: health impacts, air pollution, health-sector action, health co-benefits, just transition, integrated governance, economics and finance, and monitoring and implementation.
Each category carries a maximum of four points. Together, they assess whether governments recognise the health consequences of climate change and pollution, outline measures to address them, provide for implementation and monitoring, and connect climate action with wider public health benefits.
India’s scorecard records zero points in six categories: health impacts, air pollution, health-sector action, health co-benefits, just transition, and economics and finance. It receives one point for integrated governance and one for monitoring and implementation.
The assessment also identifies India among the countries that do not refer to air-pollution considerations in their NDCs, despite its high air-pollution mortality burden. The report further states that India’s emissions-reduction targets have been assessed by Climate Action Tracker as not aligned with the Paris Agreement.
These findings suggest that the challenge extends beyond setting emissions targets. Climate commitments also need to address how rising temperatures, deteriorating air quality and extreme weather affect people, and how governments will monitor and finance measures to reduce those risks.
Developing countries lead the rankings
The results show that stronger integration of health into climate planning is possible. Colombia topped the assessment with 29 points, followed by Nigeria with 25 and Cambodia with 24. Paraguay and Timor-Leste completed the top five, scoring 22 points each.
India Scores Just 2 Out of 32 for Integrating Health into Climate Commitments. Image credit:NDC Scorecard
Notably, 19 of the 20 highest-scoring countries were low- and middle-income economies. Colombia’s performance demonstrates how health considerations can be incorporated more comprehensively into national climate commitments.
However, the report cautions against interpreting a higher health score as evidence that a country is doing enough to reduce emissions. Nigeria, for example, combines a high score for health integration with strong climate ambition, while several other high-emitting economies have not matched their attention to health with sufficiently ambitious emissions-reduction targets.
The European Union scored 12, while China, Brazil and the United Kingdom scored nine, seven and nine respectively. The assessment found that these and other major emitters continued to fall short of the emissions reductions needed to protect health.
The findings illustrate two related requirements for effective climate policy: governments must recognise and address the health consequences of climate change, while also reducing emissions sufficiently to limit future warming.
Air pollution offers an immediate opportunity
The GCHA report identifies reductions in short-lived climate pollutants as an opportunity to deliver simultaneous climate and health benefits. These include black carbon, methane, hydrofluorocarbons (HFCs) and tropospheric ozone, which contribute to warming and, in several cases, harm human health through air pollution.
Only five countries — Cambodia, Chile, Colombia, Costa Rica and Paraguay — included targets to reduce black carbon in their climate commitments, according to the assessment.
Reducing these pollutants can slow near-term warming while improving air quality and reducing associated health risks. The report argues that these measures can generate benefits within relatively short periods, alongside the longer-term necessity of cutting carbon dioxide emissions.
For India, the absence of air-pollution considerations from its assessed NDC represents a missed opportunity to connect climate action with an existing public health priority. Integrating air-quality targets into climate planning could help policymakers address pollution and climate risks through a more coordinated approach.
Finance remains a critical challenge
The scorecard also highlights the gap between climate commitments and the resources required to implement them. Citing the latest State of Global Air Quality Funding report, the GCHA says outdoor air-quality funding receives less than one per cent of development funding, despite air pollution’s estimated economic costs amounting to five per cent of global gross domestic product through health impacts, lost productivity and reduced life expectancy.
The report argues that countries need adequate finance to translate national commitments into measures that protect communities. This is especially important for developing economies facing substantial climate risks while having fewer resources to implement adaptation and health-protection measures.
With the 31st United Nations Climate Change Conference (COP31) approaching, the GCHA identifies climate finance as a key issue for international negotiations. It also stresses the importance of maintaining commitments to a just transition away from fossil fuels, which has implications for workers, communities and public health.
For India, the scorecard provides a benchmark against which future climate commitments can be assessed. Its findings point to the need for stronger recognition of health impacts, explicit attention to air pollution, better coordination across sectors, and clearer provisions for financing and monitoring implementation.
The assessment does not measure the full extent of India’s climate or public health policies; it evaluates how health considerations are reflected in the country’s submitted climate commitment. Nevertheless, its central message is clear: climate plans need to do more than promise emissions reductions. They must also demonstrate how climate action will protect people’s health.
Climate
The Monsoon’s New Rhythm: Less Rain, More Intense Downpours
India’s deficient 2026 monsoon highlights the risks of uneven rainfall, from long dry spells to intense downpours, floods and landslides.
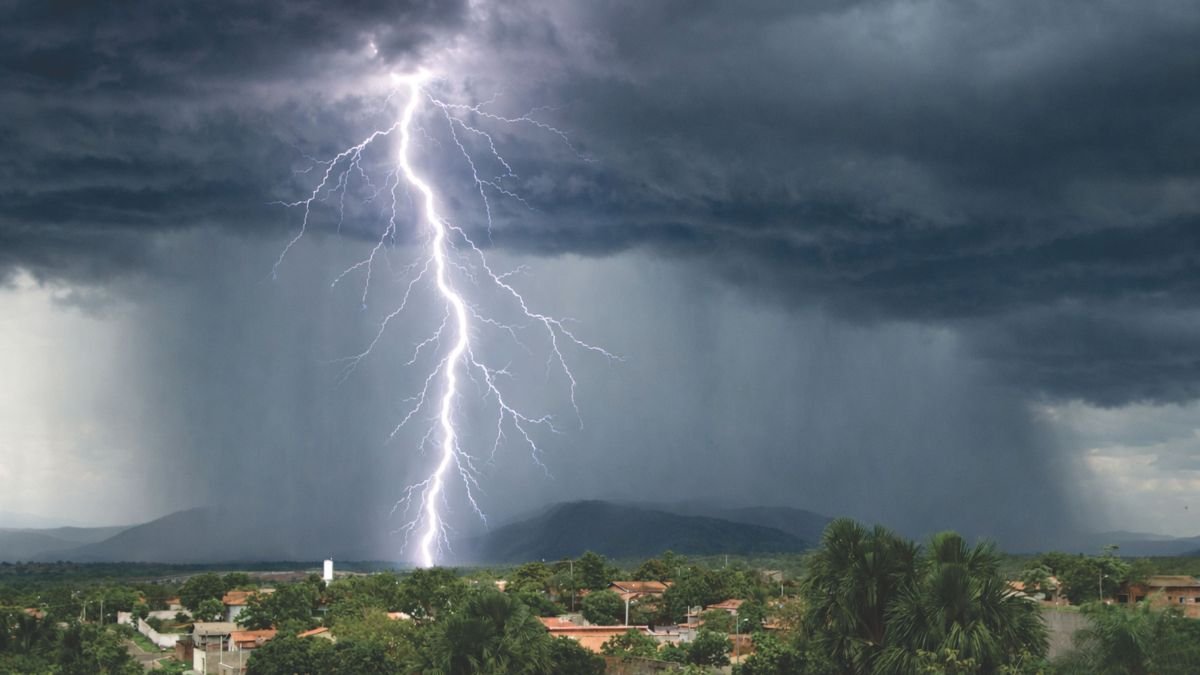
India’s 2026 monsoon ended with a significant rainfall deficit, yet intense downpours continued to cause concern. The changing monsoon pattern raises questions about floods, landslides and how the country prepares for extreme weather. India’s southwest monsoon ended in 2026 with 13% less rainfall than normal, according to the analysis by Climate Trends. Yet a shortage of rain over the season does not mean that every part of the country remained dry. Some places experienced heavy downpours even as others faced long periods without enough rain.
This is one of the challenges of a changing monsoon. Rain may fall heavily within a few hours and then disappear for days or weeks. Such a pattern can leave farmers struggling with dry soil while exposing other areas to sudden floods and landslides. The important question is not simply how much rain India receives each year. It is also how quickly the rain falls, where it falls and how prepared communities are to deal with it.
Less Rain Can Still Mean Floods
Monsoon rainfall is usually measured by comparing the total amount received during the season with the long-term average. This helps scientists understand whether a season has been wetter or drier than normal. But the total does not reveal how the rain was spread across the four months.
Imagine a district that receives most of its seasonal rainfall in just a few days. The total may look reasonable, but the heavy downpours could flood roads, damage homes and wash away crops. The same district could then face several weeks without rain, leaving its fields dry.
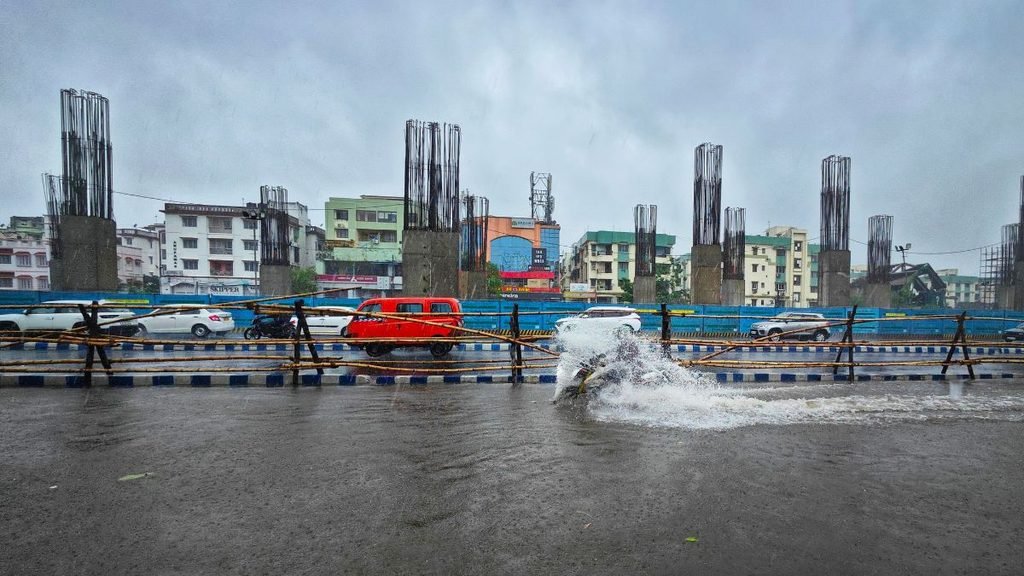
Research shows that rainfall patterns have changed in several parts of India. A study published in npj Climate and Atmospheric Science in 2024 found that short periods of heavy rain had become more frequent in central India in recent decades. It also found an increase in longer spells of heavy rain along the northern west coast. The changes were not the same everywhere, with some regions showing different trends. These findings show why seasonal rainfall figures alone cannot explain the risks people face.
The 2026 monsoon analysis by Climate Trends also points to changes in the way weather systems move across India. Mahesh Palawat, vice-president of meteorology and climate change at Skymet Weather, said low-pressure systems were spending more time over land while retaining their strength. He linked this behaviour to an increase in extreme rainfall events and cloudburst-like conditions. Understanding these changes is important because the effects of a monsoon depend partly on when and where the rain arrives.
Changing Monsoon: Are Cloudbursts Becoming More Common?
The word cloudburst is often used to describe any sudden spell of very heavy rain. However, it has a specific meaning in weather science. The India Meteorological Department defines a cloudburst as rainfall of 100 millimetres or more within one hour over a small area. Such a large amount of rain falling in a short time can quickly flood low-lying areas and trigger landslides, particularly in mountainous regions.
Not every flood or heavy downpour is a cloudburst. Flooding can also happen when rain continues for several hours, rivers overflow or drainage systems fail to carry away the water. Identifying a cloudburst requires rainfall measurements that confirm how much rain fell and how quickly it arrived.
Forecasting these events is difficult because they affect relatively small areas. A weather forecast may warn of heavy rain across a district without identifying the exact village or hillside that will receive the most intense rainfall. Research has found changes in extreme rainfall in parts of India, but this does not establish that cloudbursts are becoming more frequent throughout the country. More detailed records are needed to determine whether the frequency of cloudbursts themselves has increased.
The broader concern is that intense rainfall can cause serious damage, especially where people and infrastructure are exposed to floods and landslides.
How Climate Change Adds to the Risk
A warmer atmosphere can hold more moisture. When weather conditions allow that moisture to form rain, it can contribute to heavier downpours. Climate change does not cause every extreme rainfall event, and the amount of rain produced also depends on wind patterns, local geography and other weather conditions.
The developing El Niño is another factor to watch. This natural climate phenomenon involves warmer-than-usual sea surface temperatures in the tropical Pacific Ocean and can influence India’s monsoon and temperatures. Its effects vary from one event to another.
In the 2026 Climate Trends analysis, climate scientist Roxy Mathew Koll of the Indian Institute of Tropical Meteorology said global warming raises background temperatures and can intensify some of El Niño’s effects. He also highlighted how changes in land use, including deforestation, can worsen local impacts.
Ground Matters as much as the Weather
In hilly areas, heavy rain can soak the soil and make slopes unstable. Cutting into hillsides, removing vegetation and building on vulnerable slopes can increase the danger. When large amounts of rain arrive in a short period, water can rush downhill, carrying soil, rocks and debris with it.
Cities face a different problem. Roads, buildings and paved surfaces prevent much of the rainwater from soaking into the ground. If drains are blocked or too small to carry the water, streets can flood quickly. Building over wetlands and natural waterways also reduces the space available for excess water to flow or collect safely.
These activities do not create a cloudburst. They can, however, make its effects more destructive. Kerala offers an important example. The state recorded a 28% monsoon rainfall deficit in 2026, according to the Climate Trends analysis. Yet its steep Western Ghats slopes, rivers and densely populated areas remain exposed to the dangers of intense rainfall.
A season with less rain overall can still include localised downpours capable of causing serious damage. A rainfall deficit does not remove the risk of floods or landslides.
Beginning with Better warnings
Weather forecasts can help people prepare for heavy rain, but warnings alone cannot prevent disasters. Their effectiveness depends on whether people receive them in time, understand the danger and have a safe place to go.
India needs more reliable rainfall monitoring, particularly in mountain districts, landslide-prone areas and cities that frequently experience flooding. Automatic rain gauges and weather radars can help authorities track how much rain is falling and identify dangerous conditions. These systems also need regular maintenance and timely sharing of information.
Warnings must be useful at the local level. Telling residents that heavy rain is expected across a district may not be enough for people living beside a stream or below an unstable hillside. Local authorities need maps showing which settlements face the greatest risks, along with clear evacuation routes, shelters and plans for moving people to safety.
The way land is used also needs attention. Construction in flood-prone areas and on unstable slopes can expose more people to danger. Protecting wetlands, keeping natural drainage channels clear and preserving vegetation where it helps stabilise slopes can reduce some of the damage caused by heavy rain.
Infrastructure must be able to handle intense downpours. Drains, culverts and bridges need to be assessed against local rainfall conditions, while buildings and roads in vulnerable areas require appropriate flood and slope-risk assessments. Better planning can reduce the likelihood that heavy rain will turn into a disaster.
Preparing for dry spells is equally important. Rainwater harvesting, groundwater management and better soil care can help communities cope when rainfall becomes irregular. Farmers can also improve their resilience by choosing suitable crops and practices that require less water, depending on local conditions.
Planning for Both Floods and Droughts
India depends on the monsoon for farming, drinking water and replenishing rivers and reservoirs. But the seasonal total does not tell the whole story when rainfall is unevenly distributed.
Long dry spells can reduce soil moisture and put pressure on water supplies. Intense downpours can overwhelm drainage systems, damage crops and trigger landslides. Both risks can occur within the same monsoon season. The evidence supports closer monitoring of extreme rainfall and better preparation for its consequences. It does not yet justify claiming that cloudbursts are increasing everywhere in India.
Preparing for this changing pattern requires better weather observations, warnings that reach vulnerable communities, safer construction and protection of natural drainage systems. Water management and agriculture must also account for the possibility of long gaps between rain spells.
No forecasting system can prevent every extreme weather event. But better preparation can help people respond sooner and reduce the damage when intense rain arrives. The challenge is to prepare for the rain India receives, rather than rely only on how much rain the monsoon is expected to bring.


India–Poland to Pursue Joint Research in AI, Semiconductors and Quantum Technology

Climate Disasters Disrupted Schooling for 171 Million Students in 2025, UNICEF Finds

Brazil’s Amazon deforestation hits record low. Can the recovery last?

How Scientists Traced the Flow of Matter Around a Dead Star Using X-rays

India Scores Just 2 Out of 32 for Integrating Health into Climate Commitments

From Scams to Screens: How the National Stock Exchange Rewrote India’s Equity Story

Knowing When to Think for Ourselves: AI, Intuition and the Education of Discernment

After a Scorching Summer, Delhi’s Children Are Slow to Return Outdoors

Two Chemists Win Nobel Prize for Solving a Century-Old Puzzle: Why Life Picks One Hand Over the Other

Marshall Islands: Why the US Nuclear Legacy Is Back Before the UN

-

 Math3 months ago
The 2026 Fields Medals: Four Proofs, Four Decades-Old Problems Solved
-
EP Deep Dive: Data & Solutions3 months ago
After Kerala’s Deadliest Landslide, the Hardest Thing to Rebuild Was Childhood
-
EP Deep Dive: Data & Solutions4 months ago
West Asia Crisis: Can Kerala’s Returning Gulf Migrants Find a Future in the Green Economy?
-
Space & Physics5 months ago
India Semiconductor Mission: ‘It’s Not About Fabs. It’s About Building An Entire Ecosystem’
-
Interviews4 weeks ago
From Scams to Screens: How the National Stock Exchange Rewrote India’s Equity Story
-
Climate5 months ago
The Climate World Cup? How Climate Change Could Affect Player Performance at the 2026 World Cup
-
Society3 months ago
What Is Civilisational Diplomacy? Understanding India’s Newest Foreign Policy Tool
-
Society4 months ago
From Bell Labs to the Classroom: A Second Career in Teaching