
Climate
Overshooting 1.5°C Could Trigger Irreversible Damage to Earth’s Ice Systems, Warns UN-Backed Report
A new ICCI–UNEP report warns that exceeding the 1.5°C warming threshold could trigger irreversible damage to glaciers, polar ice sheets, permafrost and oceans, with lasting consequences for sea levels, freshwater security and ecosystems.

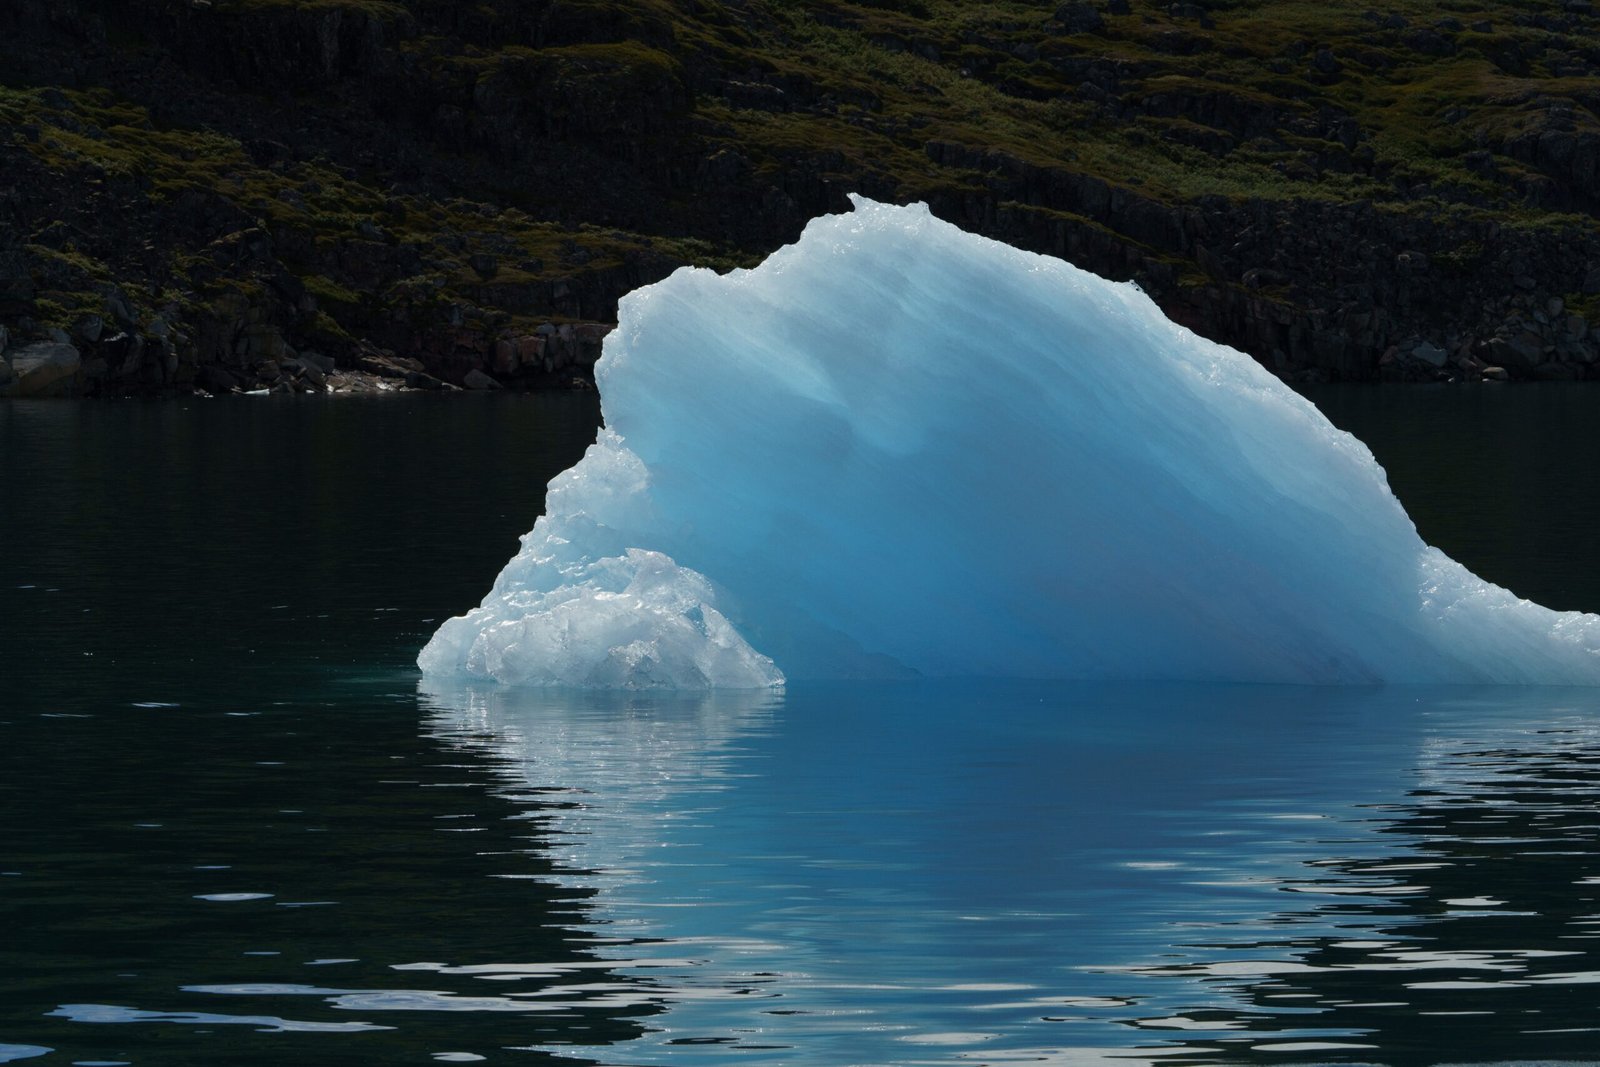
Exceeding the 1.5°C global warming threshold set by the Paris Agreement could trigger extensive and, in many cases, irreversible damage to Earth’s ice systems. Even if temperatures are subsequently brought down, several consequences of prolonged warming could persist for centuries or thousands of years, according to a new report released on November 2.
Titled Overshoot and the Cryosphere: Averting Global Meltdown, the report was produced by the International Cryosphere Climate Initiative (ICCI) in coordination with the United Nations Environment Programme (UNEP). It brings together research from more than 80 polar and mountain scientists to examine how exceeding the 1.5°C threshold would affect glaciers, polar ice sheets, permafrost, sea ice and polar oceans.
The assessment accompanies UNEP’s Limiting Overshoot Spotlight Report, examining which climate impacts are already unavoidable and how accelerated climate action could prevent further damage. Its findings come ahead of COP31 in Türkiye, highlighting the urgency of limiting the duration and extent of global temperature overshoot.
“There are no good outcomes in exceeding 1.5°C. To contain the global fallout and damage from ice loss in the world’s polar and mountain regions, overshoot needs to be kept to the absolute minimum. Temperatures must be returned to well below 1.5°C again as quickly as possible to reduce the risks,” said Dr James Kirkham, coordinating lead author of the report and Chief Scientist at ICCI.
Ice sheet instability could accelerate sea-level rise
The Greenland and Antarctic ice sheets are among the most critical components of the global climate system. Their continued retreat threatens to accelerate sea-level rise, exposing coastal communities, infrastructure and ecosystems to increasing risks of flooding and erosion.
According to the report, the two major ice sheets are losing ice at approximately six times the rate recorded during the 1990s. Further warming increases the likelihood of crossing critical tipping points, where self-reinforcing processes accelerate ice loss even if temperatures subsequently decline.
Even at 1.5°C of warming, the long-term retreat of polar ice sheets commits the world to substantial sea-level rise. The report estimates a rise of around 0.5–1 metre by 2100, potentially increasing to 2–3 metres over 2,000 years and 6–7 metres over 10,000 years.
The rate of sea-level rise is particularly important for coastal populations. Although some rise is already unavoidable, limiting additional warming could prevent the rate from exceeding the capacity of communities to adapt.
Glacier retreat threatens freshwater security
Mountain glaciers act as natural freshwater reservoirs, supplying water to nearly two billion people directly or indirectly through river systems. However, continued warming is reducing these reserves, threatening drinking water, agriculture and hydropower.
The State of the Cryosphere 2026 report highlights Switzerland’s loss of nearly 20% of its glacier ice over the past five years as evidence of the accelerating changes in mountain regions.
The global assessment also warns that glacier losses will be substantially greater under higher-warming scenarios. Under current policies, which point towards approximately 2.8°C of warming, only around 25% of global glacier ice mass may remain in the long term, compared with approximately 54% under a 1.5°C pathway.
Initially, accelerated melting can increase river flows, creating a temporary surge in water availability. However, as glaciers shrink, this additional supply declines, eventually creating prolonged water shortages.
Glacier retreat also increases the risk of glacial lake outburst floods (GLOFs), landslides and other mountain hazards. As glaciers disappear, meltwater can accumulate in lakes held back by unstable natural dams, which can suddenly fail and send destructive floods through downstream valleys.
Declining snowpack adds to the problem. Higher temperatures mean that more precipitation falls as rain rather than snow, while seasonal snow cover disappears earlier, affecting water availability in mountain regions.
Permafrost thaw adds to global warming
Beyond glaciers and ice sheets, rising temperatures are destabilising permafrost, permanently frozen ground found across Arctic and high-altitude regions. Permafrost contains approximately 1,700 billion tonnes of stored carbon.
As the ground thaws, frozen organic matter decomposes and releases carbon dioxide and methane into the atmosphere, further intensifying global warming. The report estimates that accounting for abrupt thaw and wildfire-related emissions could reduce the remaining carbon budget for limiting warming to 1.5°C by approximately 25%.
The process also creates physical hazards, including unstable infrastructure, coastal erosion, landslides and rockfalls. Wildfires can accelerate thawing by destroying the vegetation and organic soil layers that insulate frozen ground.
Unlike emissions from some other sources, carbon released through permafrost thaw cannot readily be recovered by lowering temperatures. This makes the process a particularly concerning climate feedback.
Sea ice loss threatens polar ecosystems and ocean circulation
The Arctic and Antarctic sea ice systems are also experiencing significant changes. Arctic late-summer sea ice extent has declined by more than 40% since 1979, reducing the amount of sunlight reflected into space and exposing darker ocean surfaces that absorb more heat.
The report warns that 1.5°C of warming could bring occasional ice-free Septembers in the Arctic. At 2°C, ice-free September conditions could become frequent, while warming of 3°C could result in several months of ice-free summer conditions annually.
Antarctic sea ice has also entered a period of steep decline. The Southern Ocean’s capacity to store heat means that ice loss could continue for centuries, even after atmospheric greenhouse gas concentrations stabilise.
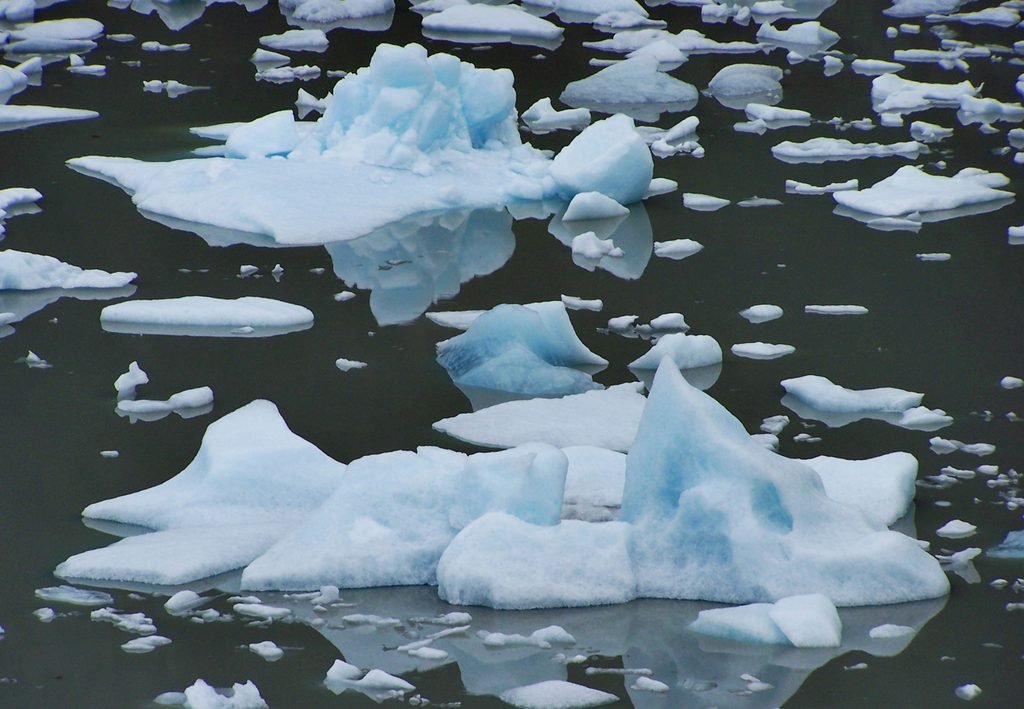
Fragments of ice float in polar waters as rising global temperatures threaten glaciers and sea ice.Image credit:Pexels
The consequences extend beyond the disappearance of ice cover. Sea ice protects coastlines from waves and storms and provides essential habitats for polar species. Its loss can accelerate coastal erosion and disrupt marine ecosystems.
Polar oceans face additional risks from warming and acidification. Cold waters absorb significant amounts of atmospheric carbon dioxide, making them particularly vulnerable to changes in ocean chemistry. Freshwater released by melting glaciers and ice sheets can further intensify acidification, threatening organisms such as pteropods that form important components of marine food webs.
Large quantities of freshwater entering the oceans can also alter ocean circulation. This raises concerns about the stability of major systems, including the Atlantic Meridional Overturning Circulation (AMOC) and Antarctic Bottom Water formation, which redistribute heat, nutrients and carbon across the global oceans.
Rapid emissions reductions remain essential
The report argues that the extent of future damage will depend on how quickly global temperatures peak and how long they remain above 1.5°C. While some losses are already unavoidable, limiting the magnitude and duration of overshoot could significantly reduce the risks.
It calls for global greenhouse gas emissions to decline by at least 5% annually, beginning immediately, with the goal of achieving net-zero emissions by mid-century. A rapid phase-out of fossil fuels and substantial reductions in methane emissions are identified as essential steps.
Methane reductions could deliver relatively rapid climate benefits, alongside improvements in air quality, public health and food security. The report also stresses the importance of carbon removal to bring temperatures back below the 1.5°C threshold after overshoot.
“Every extra fraction of a degree and every year spent in overshoot means more devastating impacts,” Kirkham added.
The assessment identifies several potential benefits of limiting overshoot, including slowing sea-level rise, potentially halting and partially reversing glacier and sea ice losses, and reducing permafrost destabilisation.
However, returning to 1.5°C should not be considered the ultimate safety threshold for Earth’s ice systems. The accompanying State of the Cryosphere 2026 assessment suggests that a genuinely safe long-term temperature target could be closer to 1°C or even below over the coming centuries.
“Decisions made in the next few years will lock in the scale of damage, both for youth today and future generations,” said Gunjan Silwal, a young Nepali glacier researcher who will attend COP31. “The tragedy in Nepal is only a foretaste.”
Alongside emissions reductions, the reports emphasise the need for climate finance to meet growing adaptation requirements and strengthen the resilience of vulnerable communities. Investments will be necessary to prepare mountain regions for changing water availability and increasing natural hazards, while coastal populations face the growing costs of adapting to sea-level rise.
The pathway back to 1.5°C will require faster fossil fuel phase-outs, deep methane reductions and expanded carbon removal. Although some damage to the cryosphere may be irreversible, the report stresses that the scale of future losses is not predetermined. Decisions taken now will determine how much of Earth’s remaining ice can be protected.


Climate
India’s Wildlife Reserves Face Changing Fire Patterns, 21-Year Study Finds
A 21-year study of 13 Indian wildlife reserves reveals contrasting wildfire trends, with fire activity increasing in the Eastern Ghats and Central India while declining in the Western Ghats. The findings highlight the implications for forest biodiversity, ecosystem regeneration and conservation strategies.

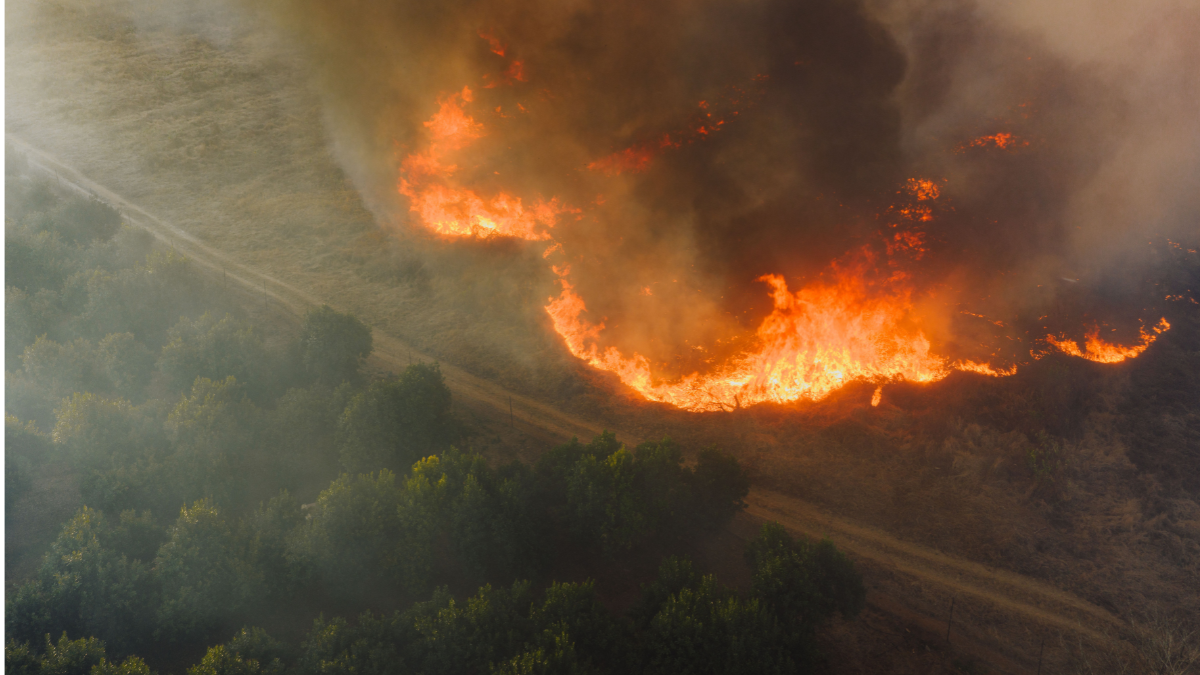
Wildfire activity increased by 9.3% annually in the Eastern Ghats and 4.6% in Central India between 2002 and 2022, while the Western Ghats recorded a significant decline. Supporting research shows how repeated fires can alter forest composition, reduce biodiversity and disrupt natural regeneration.
Wildfires are becoming an increasingly complex conservation challenge across India’s wildlife reserves, with some forest regions experiencing rising fire activity while others record a significant decline. A 21-year study across 13 wildlife reserves has identified sharply contrasting patterns in Central India, the Eastern Ghats and the Western Ghats, highlighting the need for region-specific approaches to forest fire management.
Published in Ecosphere on October 19, 2026, the study, titled Changing fire regimes in wildlife reserves of southern India: Trends, drivers, and conservation challenges, analysed satellite-derived fire data across approximately 20,000 square kilometres of protected landscapes between 2002 and 2022.
The researchers recorded approximately 16,667 square kilometres of cumulative burned area during the study period. The Eastern Ghats accounted for 59% of the total, followed by Central India at 16.6% and the Western Ghats at 8.4%.
Annual burned area increased by 9.3% per year in the Eastern Ghats and 4.6% in Central India. In contrast, the Western Ghats recorded an annual decline of 10.8%.
The researchers used data from NASA’s Moderate Resolution Imaging Spectroradiometer (MODIS), alongside climatic records, forest-cover loss data and human population estimates, to investigate the factors influencing fire activity.
Their analysis found that climate and human-related variables explained between 21% and 77% of annual fire activity across individual reserves. However, the strength and direction of these relationships varied geographically.
Climate and Human Activities Shape Fire Patterns
Drought, high temperatures and declining soil moisture emerged as important factors influencing fire activity. Eleven of the 13 reserves showed evidence of increasing fire activity during hotter and drier conditions.
Reduced soil moisture and higher atmospheric dryness can dry vegetation, making it more susceptible to burning. However, rainfall can also influence fire patterns by encouraging vegetation growth and increasing the accumulation of combustible material during subsequent dry periods.
Human activities also contributed to differences between landscapes. In Kawal Wildlife Sanctuary, population density was positively associated with fire activity. Local communities use fire in connection with collecting non-timber forest products, including mahua flowers and tendu leaves.
In Nagarjunasagar Srisailam Tiger Reserve, pastoralists use fire to encourage fresh grass growth for livestock grazing. However, human presence does not always increase burning. In Nagarhole National Park and Wayanad Wildlife Sanctuary, population density was negatively associated with burned area.
These findings suggest that local livelihood practices, vegetation conditions and forest management influence how fires originate and spread.
Earlier research provides additional evidence of the relationship between climatic conditions and fire activity. A study published in Geophysical Research Letters in 2021, titled Investigation of Forest Fire Activity Changes Over the Central India Domain Using Satellite Observations During 2001–2020, examined satellite observations across Central India.
The researchers found that approximately 70% of annual forest fires occurred during March and April. Comparing 2006–2020 with 2001–2005, they reported a doubling of fire activity during the February–June fire season and a tripling during the remaining months.
The study associated increased fire activity with persistent warmer temperatures and climate extremes, including drought and El Niño conditions. It also identified the Jagdalpur–Gadchiroli region and Indravati National Park in Chhattisgarh as particularly fire-prone landscapes.
Together, these findings highlight how climatic stress can interact with local land-use practices to influence fire regimes across Indian forests.
Repeated Fires Can Alter Forest Biodiversity
Beyond the extent of burned areas, the ecological consequences of repeated fires are an important concern. Frequent burning can affect seedling survival, tree regeneration and the composition of forest communities, potentially favouring species that are more resistant to fire.
A 2021 study published in Ecology and Evolution, titled Fire alters diversity, composition, and structure of dry tropical forests in the Eastern Ghats, examined burned and unburned plots in Eswaramala Reserve Forest in Andhra Pradesh.
Researchers compared vegetation observations from 2008 and 2018 and found that recently burned plots had higher stem density but lower tree species richness. Forest communities became dominated by a smaller number of fire-tolerant species with characteristics such as thick bark and the ability to regenerate through clonal sprouting.
The study also found that repeated fire exposure shifted the size structure of these species towards smaller, resprouting individuals. The findings indicate that higher tree density does not necessarily translate into greater biodiversity or healthier forest regeneration.
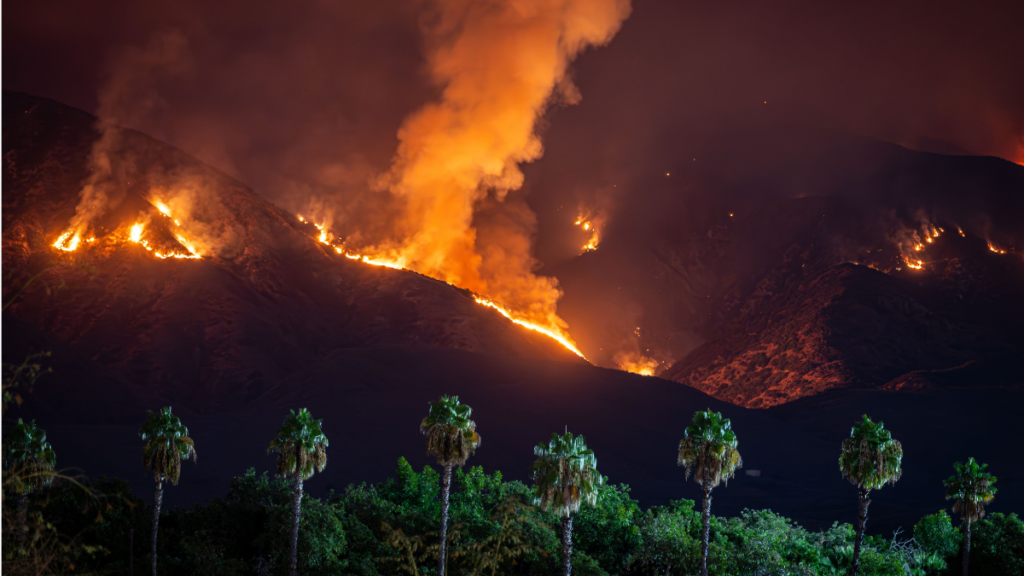
Forest fire spreading across a hillside at night, with flames and thick smoke rising above the surrounding vegetation.Image credit:Pexels
Research in the Western Ghats has reported similar concerns. A 2015 study published in Forest Ecology and Management, examined fire frequency and vegetation recovery in Mudumalai Tiger Reserve.
Using fire-frequency maps from 1999 to 2013, the researchers found that tree diversity declined as fire frequency increased. Low fire frequencies supported greater seedling density, while frequently burned areas showed changes in species composition and forest structure.
These studies provide ecological context to the latest findings by demonstrating that the consequences of fire extend beyond the immediate loss of vegetation.
Why Fire Management Needs a Regional Approach
The relationship between fire and biodiversity is not uniform across ecosystems. While repeated and intense fires can degrade forests, some grassland and savanna ecosystems depend on periodic burning to maintain their ecological characteristics.
A 2024 study in Biotropica, examined management interventions in savanna ecosystems dominated by native Cymbopogon grasses.
The researchers compared areas where fire and grasses were present with areas where fire was excluded, as well as areas where grasses were manually removed alongside fire exclusion.
They found that combining grass removal with fire exclusion was necessary to significantly improve palatable herbaceous plant biomass and plant species diversity. Fire exclusion alone was insufficient to achieve the same ecological improvements.
The research highlights the importance of combining fire management with vegetation restoration and community participation.
The authors of the 2026 Ecosphere study similarly caution against applying uniform fire-suppression policies across all protected landscapes. They recommend management strategies that account for local vegetation, climate conditions, biodiversity requirements and the traditional practices of forest-dependent communities.
The study also acknowledges limitations, including the 21-year observation period and the inability of satellite products with a 500-metre spatial resolution to detect every small fire.
As climate variability and human pressures continue to influence forest landscapes, understanding both increasing and declining fire activity will be essential. The findings suggest that effective conservation requires not simply preventing fires, but understanding when, where and how burning affects the ecological balance of India’s wildlife reserves.
Climate
Europe Braces for Extremes as Commission Unveils Climate Resilience Framework
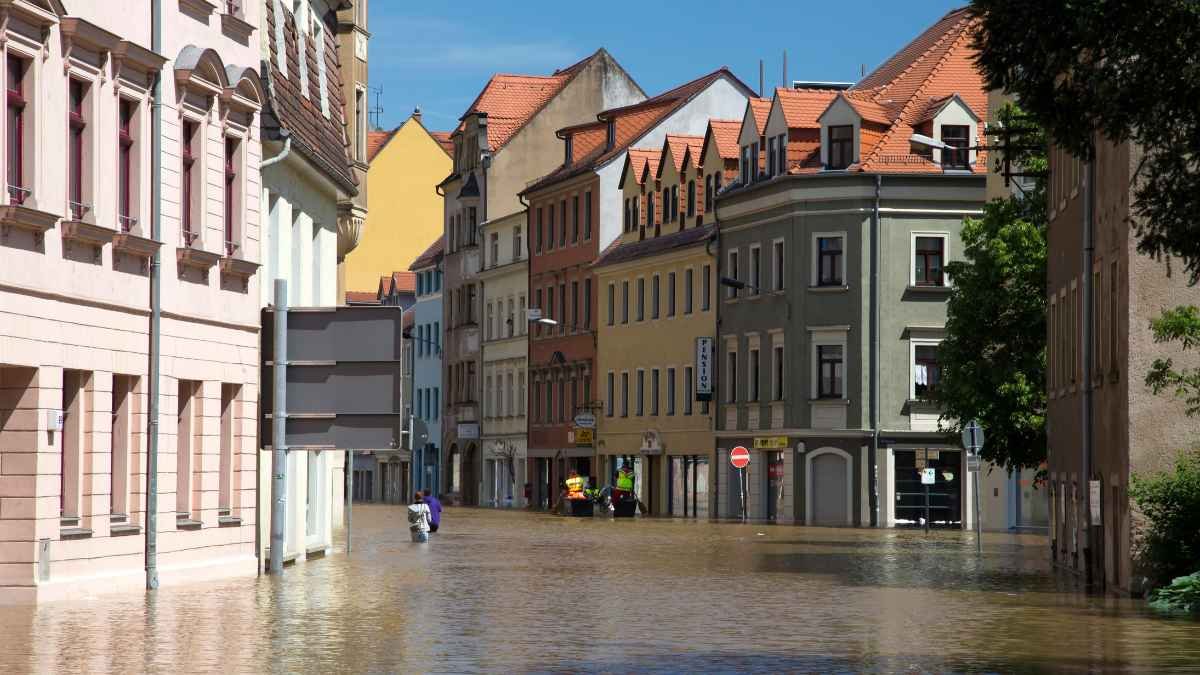
The EU climate resilience framework aims to help cities, businesses and communities prepare for heatwaves, droughts and floods.

Climate
Delhi’s Air Quality Paradox: Lower Average, Higher Everyday Pollution
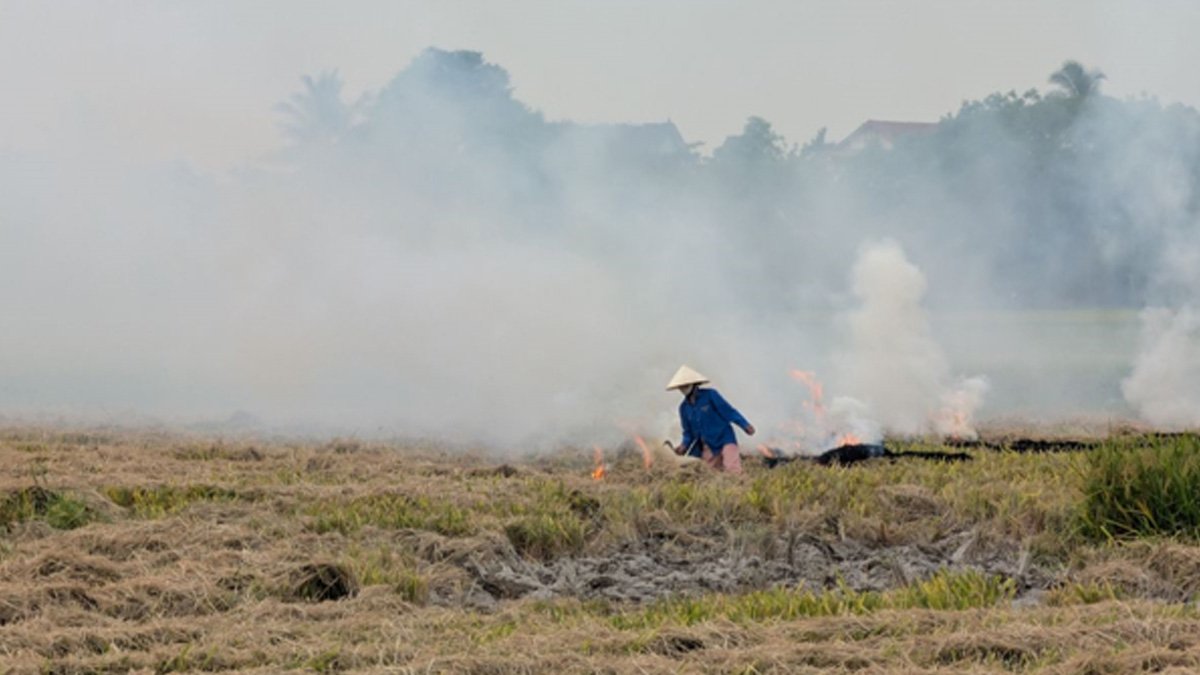
Delhi’s average AQI fell by 15.8 per cent in 2026, but its median AQI rose by 14.1 per cent. A new assessment examines what these contrasting numbers reveal about the city’s everyday pollution.


Overshooting 1.5°C Could Trigger Irreversible Damage to Earth’s Ice Systems, Warns UN-Backed Report

India Targets Recognition of One Lakh Tribal Healers. Can It Improve Healthcare and Livelihoods?

India’s Wildlife Reserves Face Changing Fire Patterns, 21-Year Study Finds

New Semiconductor Could Help Make Solar Cells More Efficient, Oxford Study Finds

Europe Braces for Extremes as Commission Unveils Climate Resilience Framework

Knowing When to Think for Ourselves: AI, Intuition and the Education of Discernment

After a Scorching Summer, Delhi’s Children Are Slow to Return Outdoors

Two Chemists Win Nobel Prize for Solving a Century-Old Puzzle: Why Life Picks One Hand Over the Other

Climate Change, Overfishing and the Uncertain Future of Bangladesh’s Hilsa Fishermen

Automated Homoeopathic Dispensing System Receives Indian Patent

-

 Math3 months ago
The 2026 Fields Medals: Four Proofs, Four Decades-Old Problems Solved
-
EP Deep Dive: Data & Solutions3 months ago
After Kerala’s Deadliest Landslide, the Hardest Thing to Rebuild Was Childhood
-
EP Deep Dive: Data & Solutions4 months ago
West Asia Crisis: Can Kerala’s Returning Gulf Migrants Find a Future in the Green Economy?
-
Space & Physics5 months ago
India Semiconductor Mission: ‘It’s Not About Fabs. It’s About Building An Entire Ecosystem’
-
Interviews1 month ago
From Scams to Screens: How the National Stock Exchange Rewrote India’s Equity Story
-
Climate5 months ago
The Climate World Cup? How Climate Change Could Affect Player Performance at the 2026 World Cup
-
Society4 months ago
What Is Civilisational Diplomacy? Understanding India’s Newest Foreign Policy Tool
-
Society5 months ago
From Bell Labs to the Classroom: A Second Career in Teaching