
Society
Mining woes in the Congo echo colonial blues
The Katanga region is a major deposit for rare-earth minerals that can supply Global North’s needs to manufacture EV batteries. However, there’s a raging conflict in the region that sees human depravity reaching an extreme. And the Global North’s partly to blame for it.


Did you know that the Democratic Republic of Congo (DRC) houses more than half of the world’s cobalt reserves? It’s one of the major supplier of cobalt to the global market. The cobalt production there comprises 70% of the worldwide cobalt production in 2021. These facts were according to the 2022 report by the National Minerals Information Centre of the US’ Geological Survey.
The DRC is also one of the main global providers of raw materials to the electric vehicle industry. These include battery electric vehicles (BEVs) and plug-in hybrid electric vehicles (PHEVs), which are mainly produced by China, Europe, and the United States. This is an industry that a McKinsey report indicated the demand for lithium-ion batteries (also ubiquitous in smartphones), would go up to 32% annually between 2015 and 2030.
However, the political stability in the DRC can’t be any dire than ever before. Internal strife in North Kivu is violent, as various militant factions and the DRC military themselves terrorize local mine workers into accepting the most unacceptable terms. They occupy streets and force people into working at mines if they can’t bribe their way out.
Piasecki Poulsen’s 2010 film “Blood in The Mobile” documented the life of mine workers at the Bise tin mining site under DRC military control.
In the film, Poulsen describes the mining site had “improvised mine shafts” that could cause “the mountain to collapse at any moment”. The low safety standards quite often led to fatal accidents in these artisanal mines. Amdist these appalling circumstances, some 15,000 to 20,000 people, including children, worked in Bisie. However, they’re effectively trapped there providing slave labour, as they can’t afford to pay the military for their own escape.

Children working hard at a mining site in Congo. Credit: Jclaboh / Wikimedia
The film documented the DRC military generating as much as $300,000 to $600,000 per month back then.
As this tragedy plays out, the DRC government and the military operate with impunity.
Amnesty International’s 2016 reported on these appalling labour conditions, inexcusable child labour, health hazards and physical abuse people were subjected to.
However, there are ways to stop this systemic abuse, if other stakeholders evolved in these battery manufacturing do their bit.
Colonial blues
The foreign mining companies are all from the Global North – namely the US, UK, Germany, South Korea, China and Japan. They were all in need of some serious self-reflection.
At least for the West, this holds true now as much as it did back then when they colonized the Congo region in the late 19th century.
Then, King Msiri of the Yeke Kingdom, had access to vast natural resources over the Katanga region he ruled. And this attracted European merchants who arrived there.
Belgium’s King Leopold II initiated plans to consolidate territory in central Africa soon after, through funding European ‘expeditions’ into Africa.
In 1884, Leopold II unilaterally established the Congo Free State (CFS). What happened next though, was harrowing. Leopold II had King Msiri and his son assassinated. Resistance fighters had their hands cut off. Indigenous people were to engage in slave labour until their deaths. As the colonial era was now underway, local chieftains then had to send for manpower from villages, to build infrastructure to mine the natural resources.
The Belgians dominated human and natural resources in Congo, and its legacy has remained until recently.
The colonial exploitation in CFS was supported by the economic interests of private companies as well. King Leopold II gave concessions to private companies in which he was involved as a stakeholder. When the innovation of pneumatic tyres triggered the rubber boom in Europe around 1900, Dunlop Rubber supported King Leopold II and successfully attained the vast amount of rubber supply from him.
Neo-colonialism
The natural resources in Congo were still amid the global and local interests after its independence as the DRC. The assassination of Patrice Lumumba in 1960, the first prime minister of the DRC and independence leader, exposes US’, Belgium’s and Britain’s interests to secure natural resources even post-independence. The West never quite left the Katanga region for what it’s worth.

Patrice Lumumba in Brussels (1960). Credit: Herbert Behrens (ANEFO)
Belgium attempted the secession of Katanga, a region with an enormous amount of copper, cobalt and radium reserves. Union Miniere, a Belgian mining enterprise, provided for acid then used by Belgian agents to dispose of Lumumba’s corpse.
In the aftermath, the Belgians and the US’ propped up Joseph-Desire Mobutu as leader in a coup d’etat.
Thereafter, the local chieftains and plantation owners oversaw forced labour in plantations under the Mobutu regime.
The colonial era, never really quite subsided in the Congo region. It’s neo-colonialism in a way – for the ordinary people there, the subjugation merely changed powers. The rot in the system stems from far deep, not within the DRC so much as the Western powers which shaped the political situation and geography there. Crisis could be manufactured, if they wanted.
Although today, they won’t have to pay for the colonial baggage, they surely are held responsible if even accusations of slave labour were made. The conflict in North Kivu wouldn’t end anytime soon. But foreign mining companies have a responsibility to ensure that their supply of raw materials aren’t dependent on slave labour at the least.
Taking responsibility
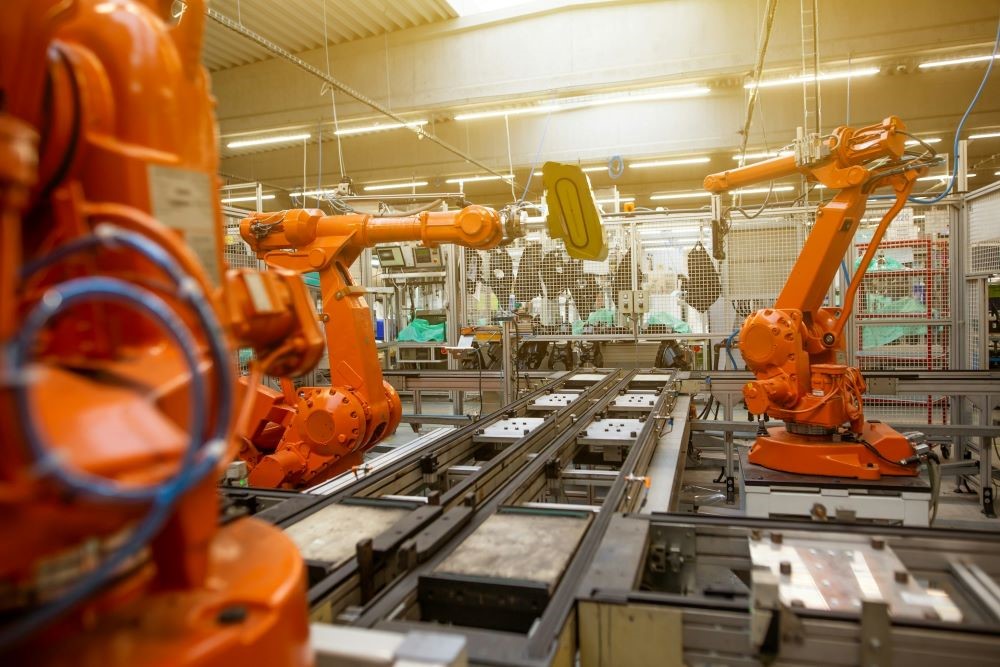
In 2021, the German automobile manufacturing giant, Volkswagen released a report on their internal investigation to ensure their supply chains weren’t in any way dependent on child labour or acts of human slavery.
Credit: Simon Cadula / Unsplash
Volkswagen works in sustainable initiatives such as Responsible Source Initiatives, and the Global Battery Alliance. The 2021 detailed report informs an overview of Volkswagen’s efforts towards mitigating specific risks of raw materials.
Volkswagen conducted audits of 25 suppliers in 2021 and took a lot of measures: safety training and signs, updates on vehicle and machinery maintenance, improvements on waste assessment and management, among others.
As well-meaning as they maybe, none of this can protect mine workers, who’s at the base of a power hierarchy where the foreign manufacturers are at the top. And the trapping’s in the hierarchy.
The mining companies can have these workers precariously removed from the supply chain if they want to.
One example is when mining companies to replace artisanal miners with flexible workforces in the DRC, which made artisanal miners more vulnerable to the volatility of cobalt price and reputational damage.
Since cobalt was discovered in the copper slags centuries ago, Congo soon became the major cobalt supplier to the US and the UK during World War II supported by the sharp increase in demand for weaponry. After WWII, Congo (later the DRC and Zaire) was to be involved in Cold War, having their leadership toppled by the Western Bloc, as they and then the Eastern Bloc interfered with the domestic affairs, just like during the colonial era.
Amidst all these geopolitics playing out, it’s the common people who’re paying a price with their well-being. And it’s time the world pays more attention to this.











Society
Global Job Market Faces a Growing Inclusion Gap as AI and Digitalisation Reshape Work
Global employment faces a growing inclusion gap as AI and digitalisation reshape the labour market. UN and ILO reports highlight persistent informal employment, youth exclusion and unequal access to the skills needed for emerging jobs.


The global economy is undergoing a profound employment transition, driven by artificial intelligence (AI), digitalisation, demographic changes and the shift towards greener industries. Yet, while these forces are expected to create new career opportunities, access to employment and the benefits of technological progress remain deeply unequal, according to the United Nations’ World Social Report 2026.
Released on October 15, the report, published by the UN Department of Economic and Social Affairs (UN DESA), warns that billions of people remain excluded from the jobs, skills, infrastructure and social protections required to participate in economic transformation. Its findings highlight a central challenge for policymakers: creating employment opportunities is not enough unless people can access them and secure decent working conditions.
The scale of the problem is evident in the report’s latest figures. In 2025, 58 per cent of workers worldwide were informally employed, while 27 per cent of young women aged 15–24 were neither employed nor participating in education or training. An estimated 2.2 billion people also lacked internet access, limiting their ability to benefit from digital services, online learning and emerging employment opportunities.
More Jobs, but Unequal Opportunities
The challenge extends beyond unemployment to the quality and security of work. The International Labour Organization’s Employment and Social Trends 2026 report estimated that global unemployment would remain at 4.9 per cent in 2026, equivalent to approximately 186 million people. However, nearly 300 million workers continued to live in extreme working poverty, surviving on less than US$3 a day. The report also projected that 2.1 billion workers would be in informal employment in 2026, often without adequate social protection or employment security.
Young people face particular difficulties entering the labour market. According to the ILO, youth unemployment reached 12.4 per cent in 2025, while approximately 260 million young people were not in employment, education or training. For many, the transition from education to work remains uncertain, particularly where economies fail to generate enough productive jobs.
These challenges coincide with substantial changes in the kinds of jobs employers expect to need. The World Economic Forum’s Future of Jobs Report 2025, based on projections from more than 1,000 employers, estimates that technological, economic, demographic and green-transition trends could create 170 million jobs globally by 2030 while displacing 92 million. This would produce a net gain of 78 million jobs. However, the report warns that the transition will require extensive workforce adaptation. Nearly 40 per cent of workers’ existing skills are expected to change by 2030, and 63 per cent of surveyed employers identified skills gaps as a major barrier to business transformation.
The projections suggest that the central employment challenge is not simply whether jobs will disappear, but whether workers can move into emerging roles. Demand is expected to grow in areas such as AI, data analysis and cybersecurity, alongside essential occupations in healthcare, education and agriculture. Workers whose skills do not match changing requirements risk being excluded even as new vacancies emerge.
Digital Access and Skills Will Shape the Transition
Access to technology is another dividing line. The World Bank’s Digital Progress and Trends Report 2025 identifies disparities in connectivity, computing infrastructure, relevant data and digital skills as barriers to wider participation in the AI economy. While AI adoption is expanding, high-income countries continue to dominate important areas of AI innovation and computing capacity.

Representational image.Image credit:Pexels
For people without reliable internet access, affordable devices or opportunities to acquire digital skills, the shift towards online recruitment, digital services and AI-assisted work can deepen existing disadvantages. Connectivity alone, however, is insufficient: workers also need relevant training, accessible education and opportunities to apply their skills in productive employment.
The UN report argues that governments must invest in quality education, lifelong learning, digital and AI capabilities, affordable connectivity and stronger social protection. Labour-market policies must also support decent working conditions, equal opportunities and training that helps workers move between occupations.
For developing economies with large young populations, the stakes are particularly high. A growing workforce can support economic growth only when enough productive jobs are available and workers can acquire the capabilities those jobs demand. Without such opportunities, demographic potential can translate into prolonged unemployment, insecure work and widening inequality.
EP Deep Dive: Data & Solutions
After a Scorching Summer, Delhi’s Children Are Slow to Return Outdoors
Extreme heat and children are the focus of this EdPublica report. Parents in Delhi and Noida explain how rising temperatures, air pollution and changing routines are keeping children indoors.

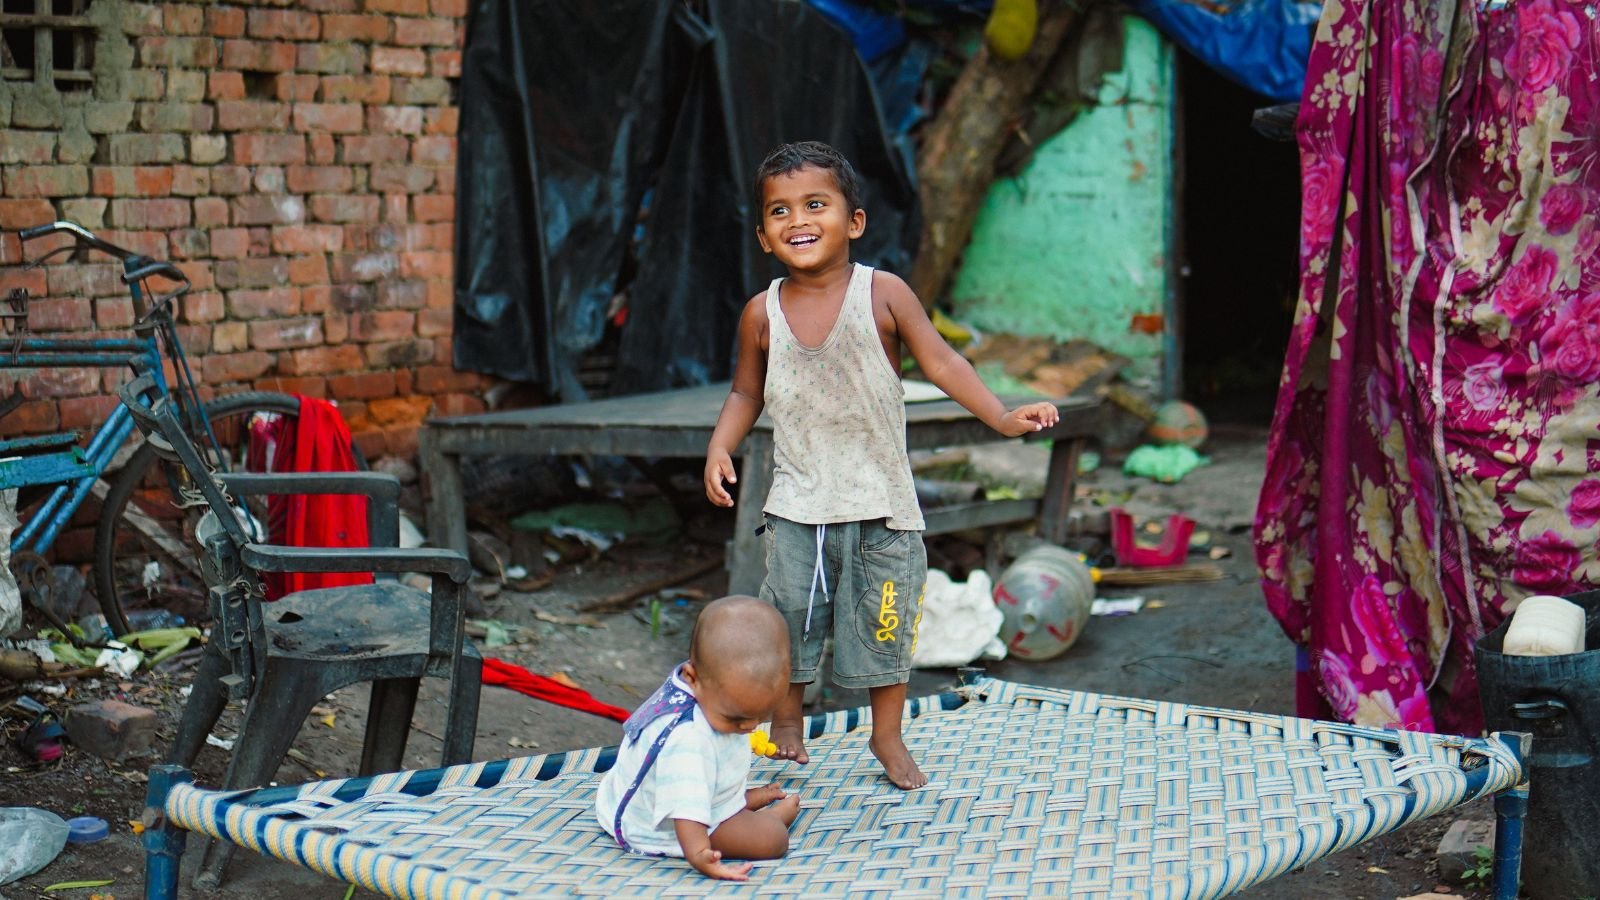
After months of extreme heat, Delhi’s children face another challenge: returning outdoors. Heat, air pollution and changing routines are reshaping how children play. EdPublica spoke to parents in Delhi to understand how extreme heat has changed their children’s play habits and what it might take to bring them back outdoors.
New Delhi: Mohini Bisht is a first-time mother. Her two-year-old son, Shomu (name changed), has just begun to string together his first words. Among the first he learned is “AC” (air conditioner). Living in the National Capital Territory, the family faces daytime temperatures that regularly reach between 42 and 45 degrees Celsius.
“Mummy, garmi lag rahi hai, AC chala do” (“Mummy, it’s hot, turn on the AC”), her son now says. He has learned to turn the AC on and off by himself. On especially humid days, he gets up and flicks the switch on his own.
In April, Delhi saw a maximum of 42.8 degrees Celsius, the hottest for that month in four years. In May, nighttime heat also broke records, with the minimum temperature hitting 32.4 degrees Celsius, the warmest May night in nearly 14 years, according to the India Meteorological Department (IMD).
In June, the heat index, or ‘feels-like’ temperature, soared to 51.3 degrees Celsius, the highest of the year. The heat index combines air temperature and relative humidity to show how hot it actually feels, not just what the thermometer shows.
“The whole day you’re just waiting for evening so you can go out,” Bisht said. As temperatures rose, she stopped taking her son out to play. “If the child gets dehydrated or faces issues, it becomes a big problem,” she said. Her parents and in-laws also advised her not to take him outside.
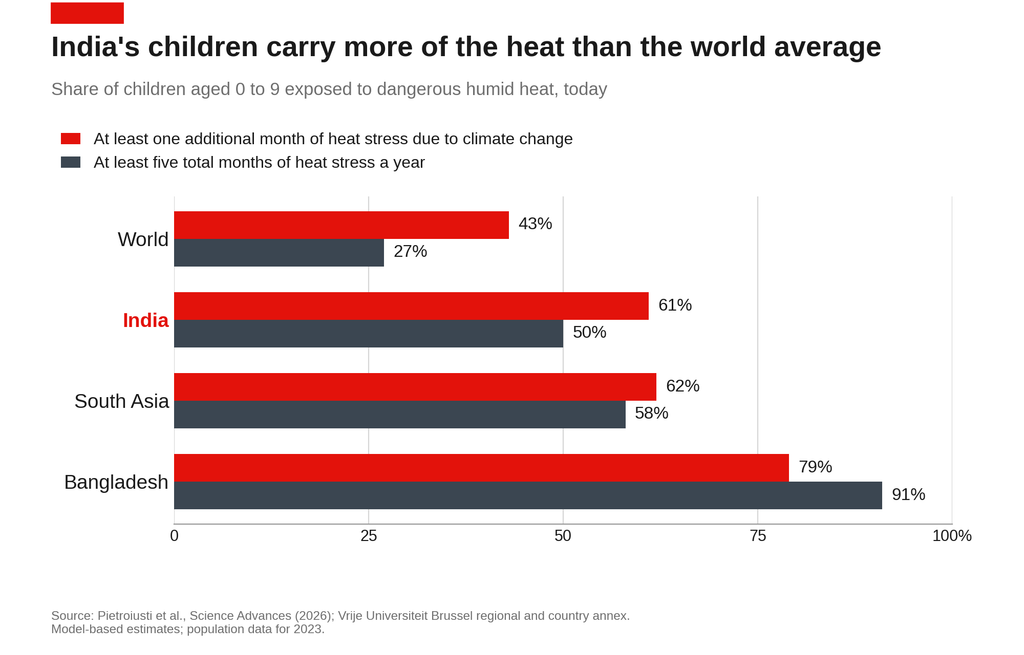
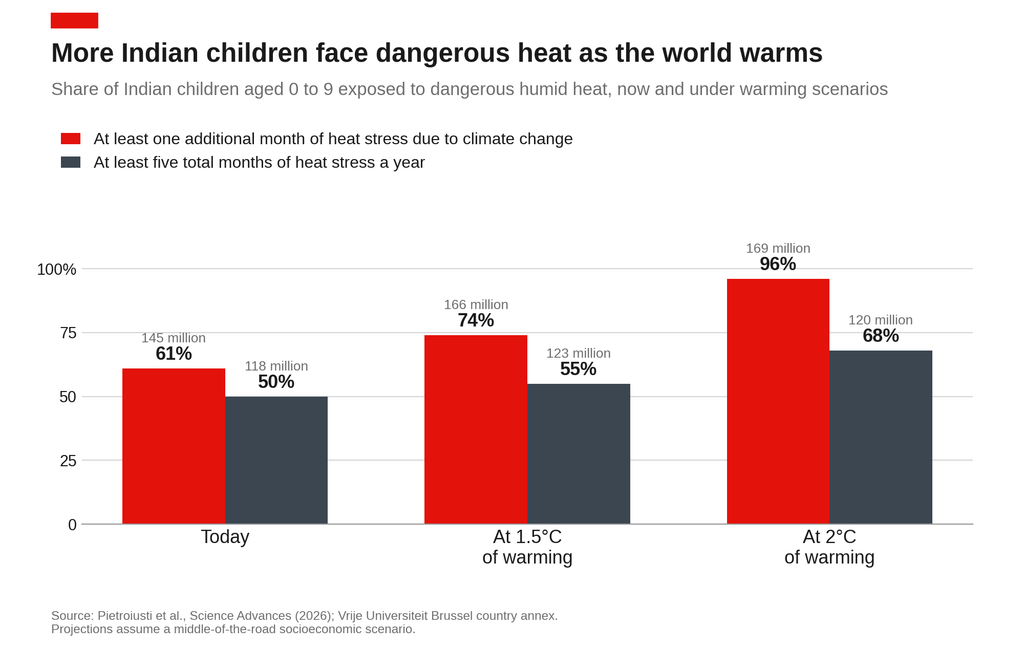
Her caution has a basis. India’s exposure is higher than the global average. Worldwide, up to 560 million children aged 0 to 9, or 43 per cent, live through at least one additional month of heat stress a year because of climate change. In India the share is 61 per cent. For five or more months of total heat stress, the Indian share is 50 per cent, against 27 per cent globally. South Asia is one of the regions with the most children exposed: about 167 million children, or 62 per cent, face an additional month, and in Bangladesh the share is 79 per cent.
Extreme Heat and Children: The Challenge of Outdoor Play
Nearly 145 million Indian children aged up to nine, or 61 per cent of that age group, live through at least one additional month of dangerous heat stress each year because of human-induced climate change, according to a study published in August in Science Advances by researchers led by Vrije Universiteit Brussel. The study estimates that climate change has doubled the number of Indian children facing five or more months of dangerous heat a year, from 59 million to 118 million. The authors note that children are especially vulnerable because their bodies heat up faster than adults’ and regulate temperature less efficiently.
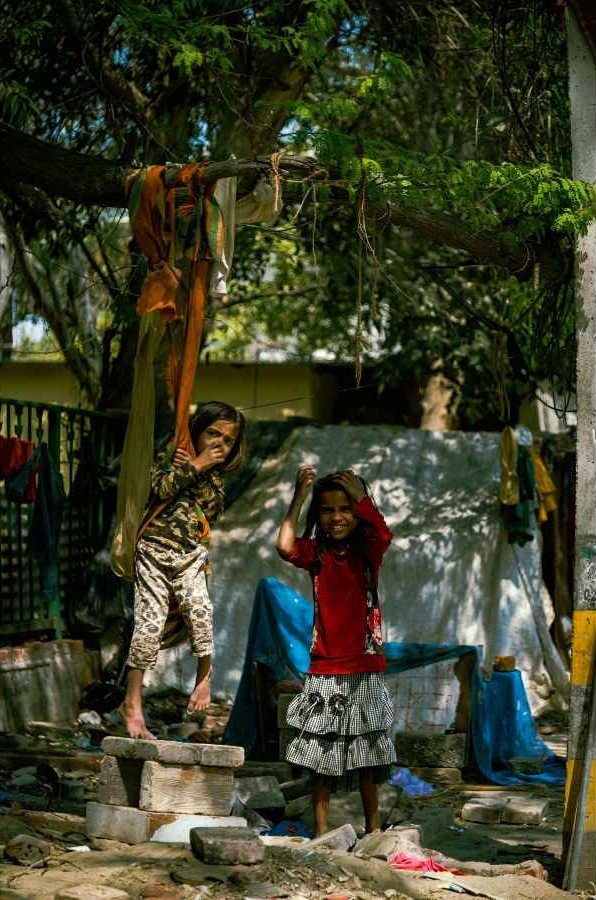
Even as early October brings daytime highs in Delhi that linger in the mid-30s, according to IMD forecasts, summer is retreating from most of north India, bringing the season’s first pleasant evenings. For many families, this raises the question: after months indoors due to oppressive heat, will children return outside?
The challenges don’t end with summer. “Apart from the heat, there is also poor air quality,” said Dr Himani Narula, a development paediatrician in New Delhi. Seasonal illnesses, too, play a role: “Sometimes there is a dengue season and other times there is a flu season.” Parents worry their children will pick up infections, making it hard to let them outside for long. “For all these reasons, children are ultimately at home, even when the weather improves,” she said.
The air is a genuine constraint, not just a parental worry. A 2021 study in Environmental Science and Pollution Research reported an almost 30 per cent rise in daily emergency visits for acute respiratory symptoms among Delhi’s children on high-pollution days. Last winter, the Delhi government suspended outdoor school activities in November and December after the Supreme Court warned against holding outdoor sports in hazardous air.
EdPublica spoke to seven parents from middle-class households in Noida-Delhi, all of whom said they have reorganised their days around the heat, moving their children’s playtime from evening to night to escape gruelling temperatures and humidity. They are not a representative sample, and EdPublica did not measure how much time children actually spend outdoors.
“Dinner is cooked first, then comes the outing, then a late meal and bed. The schedule has changed because of the heat,” said Sunita Kumar, a home tutor and mother of three, including a six-year-old.
Kumar, who lives in Mayur Vihar, New Delhi, worries the routine is changing children’s relationship with the outdoors. “Kids nowadays aren’t seeing the sun,” she said. “They go to school in the morning, stay inside all day, then go home. Even a one-hour tuition is indoors.” This habit, she fears, may outlast the weather. “Kids have built a habit without realising,” she said.
“Kids nowadays aren’t seeing the sun”
The pattern has research behind it. In a 2023 study in JAMA Pediatrics, researchers fitted preschoolers at a university childcare centre in Texas with activity monitors for a week. On hotter days, the children spent more of their outdoor play sedentary, about 70 per cent of it at 35 degrees Celsius against 62 per cent at 22 degrees, and less in moderate-to-vigorous activity, 21 per cent against 27 per cent. The sample was small and the temperatures were milder than Delhi’s summer, but the direction is clear. A 2022 review of more than 150 studies in the journal Temperature also warned that parents’ perception that it is “too hot to play” can further restrict children’s activity.
Moving play to cooler hours is, in fact, what heat-safety guidance advises, alongside hydration and shaded, green outdoor spaces. In that sense, the parents’ adaptation is sensible. The concern is what happens once the heat passes.
The human body and brain tend to acclimatise to repeated exposure of any kind, Dr Narula explained. Keeping children in air-conditioned rooms and away from natural weather, she said, can get their bodies used to the indoor environment and blunt their heat tolerance.
Direct evidence in children is scarce. A small study in Indoor Air compared 20 adults used to air-conditioned and naturally ventilated environments in a climate chamber, measuring skin temperature, sweat rate and thermal comfort. It concluded that long-term exposure to stable air-conditioned environments may weaken thermal adaptability. The study involved adults, not children, and does not show that air conditioning harms a child’s heat tolerance, but it makes Dr Narula’s concern plausible.
But temperature isn’t the only factor shaping how children respond to heat. Bisht notes that her son complains about the heat when alone with her, but behaves differently around friends. “If I bring him with friends or cousins, he plays on the balcony in the sun and enjoys it,” she says. “But if he’s alone with me, he voices his opinions.”
“Children’s tolerance for discomfort changes when other kids are around,” Dr Narula explained. “What the kid is saying is I will accept the discomfort of heat if it means I am enjoying time with peers.” The brain is adapting to these climatic challenges, and according to her, the child needs to get used to this conditioning.
Research on friendship and physical activity points the same way. A 2013 systematised review of friendship networks in the International Journal of Behavioral Nutrition and Physical Activity found that higher activity among friends is associated with higher activity in the individual, and longitudinal studies showed children’s activity shifting to match their friends’. Much of this work is observational, and it is hard to separate influence from children simply choosing similar friends. Still, it hints at what could bring children back outdoors: the company of other children. Parents often tell Dr Narula their kids stay home because there are few other children for them to play with.
Schools, where children already gather, are the obvious place to start, Dr Narula said. Before lessons begin, when the morning heat is lower, children could spend time in the open air, she said: sports, a prayer assembly, physical training, “any kind of activity which children can do with each other in a good setting.”
From toddlerhood through the teenage years, “children look for peers,” something that motivates them far more than being around parents, Dr Narula explained. The outdoors, she said, offers something indoor play cannot, and sunlight helps raise dopamine levels and, with them, mood.
The best-documented benefit of outdoor time in children is for eyesight. A 2024 meta-analysis in Ophthalmic Research found that children and adolescents with the most time outdoors had roughly half the risk of developing myopia of those with the least, and that risk fell as outdoor hours rose: going from 3.5 to 7 hours a week was linked with a 20 per cent lower risk. The leading explanation is that bright outdoor light prompts the retina to release dopamine, which slows the eye’s growth, though the mechanism is not fully settled. Outdoor time did not slow the progression of myopia in children who already had it.
The cooler weeks may be a short window. Whether children use it will depend less on the thermometer than on whether there is anyone outside to play with, and on how long the air stays clear enough to let them.
This article is written as part of the Media Fellowship under the Cities on Fire Initiative in Bangkok, Colombo, Jakarta and Manila and ‘Cooler Cities. Healthier Children. Brighter Futures.’ Initiative in New Delhi.
Health
World Mental Health Day: How Late-Night Scrolling May Be Disrupting Sleep and Fuelling Anxiety
New research is examining how late-night smartphone use, disrupted sleep and passive social media scrolling may be linked to anxiety. Studies highlight the importance of digital habits and bedtime routines in understanding their potential effects on mental health, particularly among young people.

The day often ends with one last check of Instagram, a few minutes on YouTube or a scroll through messages before sleep. But what begins as a brief digital break can stretch late into the night, delaying bedtime and keeping the mind engaged when it should be winding down. Researchers are increasingly investigating whether this pattern of digital exposure, through its effects on sleep, may contribute to anxiety and other mental health difficulties among young people.
As World Mental Health Day is observed on October 10, emerging evidence suggests that the relationship between digital media and psychological well-being may depend not simply on how long people spend online, but also on when and how they use it.
A scoping review published in Computers in Human Behavior Reports in March 2026 examined longitudinal research on social media use and sleep among young people. The review found that approximately 70% of the longitudinal studies examined reported at least one negative association between social media use and sleep outcomes. The most consistent links involved later bedtimes and longer periods spent trying to fall asleep, particularly among those with problematic social media habits or who used platforms at bedtime.
The findings are significant because longitudinal studies track participants over time, helping researchers investigate whether digital habits precede subsequent changes in sleep. However, the authors cautioned that many studies relied on self-reported screen use and sleep patterns, limiting the strength of conclusions about cause and effect.
The review also identified an important distinction: total screen time alone did not consistently predict poor sleep. The timing of use and difficulty controlling online behaviour appeared to matter.
When sleep becomes the missing link
Sleep may help explain why certain patterns of digital engagement are associated with poorer mental health. Notifications, emotionally charged content and the pressure to respond immediately can keep users mentally alert. Scrolling in bed can also displace time that would otherwise be spent sleeping.
Insufficient or disrupted sleep can affect emotional regulation, concentration and the ability to manage everyday stress. For someone already experiencing anxiety, a poor night’s sleep may make worries more difficult to manage the following day. Repeated sleep disruption may then reinforce a cycle of distress and further digital engagement.
A systematic review and meta-analysis published in the Journal of Affective Disorders in December 2024 provides a broader picture of this relationship. Researchers assessed 182 studies involving 1,169,396 participants, with 98 studies and 102,683 participants included in the meta-analyses.

Representational image.Image credit:Pexels
The researchers found small but statistically significant associations between general social media use and anxiety and depression. Problematic social media use showed associations with anxiety, depression and sleep problems, alongside lower well-being. Importantly, ordinary social media use was not consistently associated with sleep problems or sleep duration, whereas problematic use was associated with sleep difficulties.
The relationship may also operate in both directions. People who struggle to sleep or experience anxiety may turn to their phones for distraction, reassurance or social connection. This can make it difficult to determine whether digital habits contribute to distress, whether distress encourages more digital engagement, or whether both are influenced by other factors.
Beyond the screen-time debate
The findings raise questions for families, schools, technology companies and public-health professionals. Advising young people to reduce screen time may be insufficient if it does not address bedtime habits, compulsive checking, online pressures and the reasons they turn to digital platforms in the first place.
Digital platforms can also provide friendship, information and mental health support. The challenge is to distinguish beneficial engagement from patterns that disrupt rest and emotional well-being.
As research advances, scientists will need to examine not only how much time young people spend online, but also what they experience there and how digital habits interact with sleep and existing vulnerabilities. The question is no longer simply whether people spend too much time on their phones. It is whether constant connectivity leaves enough room for the rest, recovery and emotional balance that mental health requires.


Brazil’s Amazon deforestation hits record low. Can the recovery last?

How Scientists Traced the Flow of Matter Around a Dead Star Using X-rays

India Scores Just 2 Out of 32 for Integrating Health into Climate Commitments

Global Job Market Faces a Growing Inclusion Gap as AI and Digitalisation Reshape Work

FSSAI Moves to Restrict Added Sugars in Infant Foods, Citing Need for Stronger Nutritional Safeguards

From Scams to Screens: How the National Stock Exchange Rewrote India’s Equity Story

Knowing When to Think for Ourselves: AI, Intuition and the Education of Discernment

After a Scorching Summer, Delhi’s Children Are Slow to Return Outdoors

Two Chemists Win Nobel Prize for Solving a Century-Old Puzzle: Why Life Picks One Hand Over the Other

Marshall Islands: Why the US Nuclear Legacy Is Back Before the UN

-

 Math3 months ago
The 2026 Fields Medals: Four Proofs, Four Decades-Old Problems Solved
-
EP Deep Dive: Data & Solutions3 months ago
After Kerala’s Deadliest Landslide, the Hardest Thing to Rebuild Was Childhood
-
EP Deep Dive: Data & Solutions4 months ago
West Asia Crisis: Can Kerala’s Returning Gulf Migrants Find a Future in the Green Economy?
-
Space & Physics5 months ago
India Semiconductor Mission: ‘It’s Not About Fabs. It’s About Building An Entire Ecosystem’
-
Interviews4 weeks ago
From Scams to Screens: How the National Stock Exchange Rewrote India’s Equity Story
-
Climate5 months ago
The Climate World Cup? How Climate Change Could Affect Player Performance at the 2026 World Cup
-
Society3 months ago
What Is Civilisational Diplomacy? Understanding India’s Newest Foreign Policy Tool
-
Society4 months ago
From Bell Labs to the Classroom: A Second Career in Teaching