
Earth
Madhya Pradesh: Crop Damage Due to Excessive Rain—What Could Be the Solution?
Excessive rains in Madhya Pradesh have destroyed crops across villages like Chirai and Kesli, leaving farmers’ livelihoods at risk. Experts suggest simple solutions like drainage channels and raised-bed sowing to protect fields and build resilience against erratic monsoons.

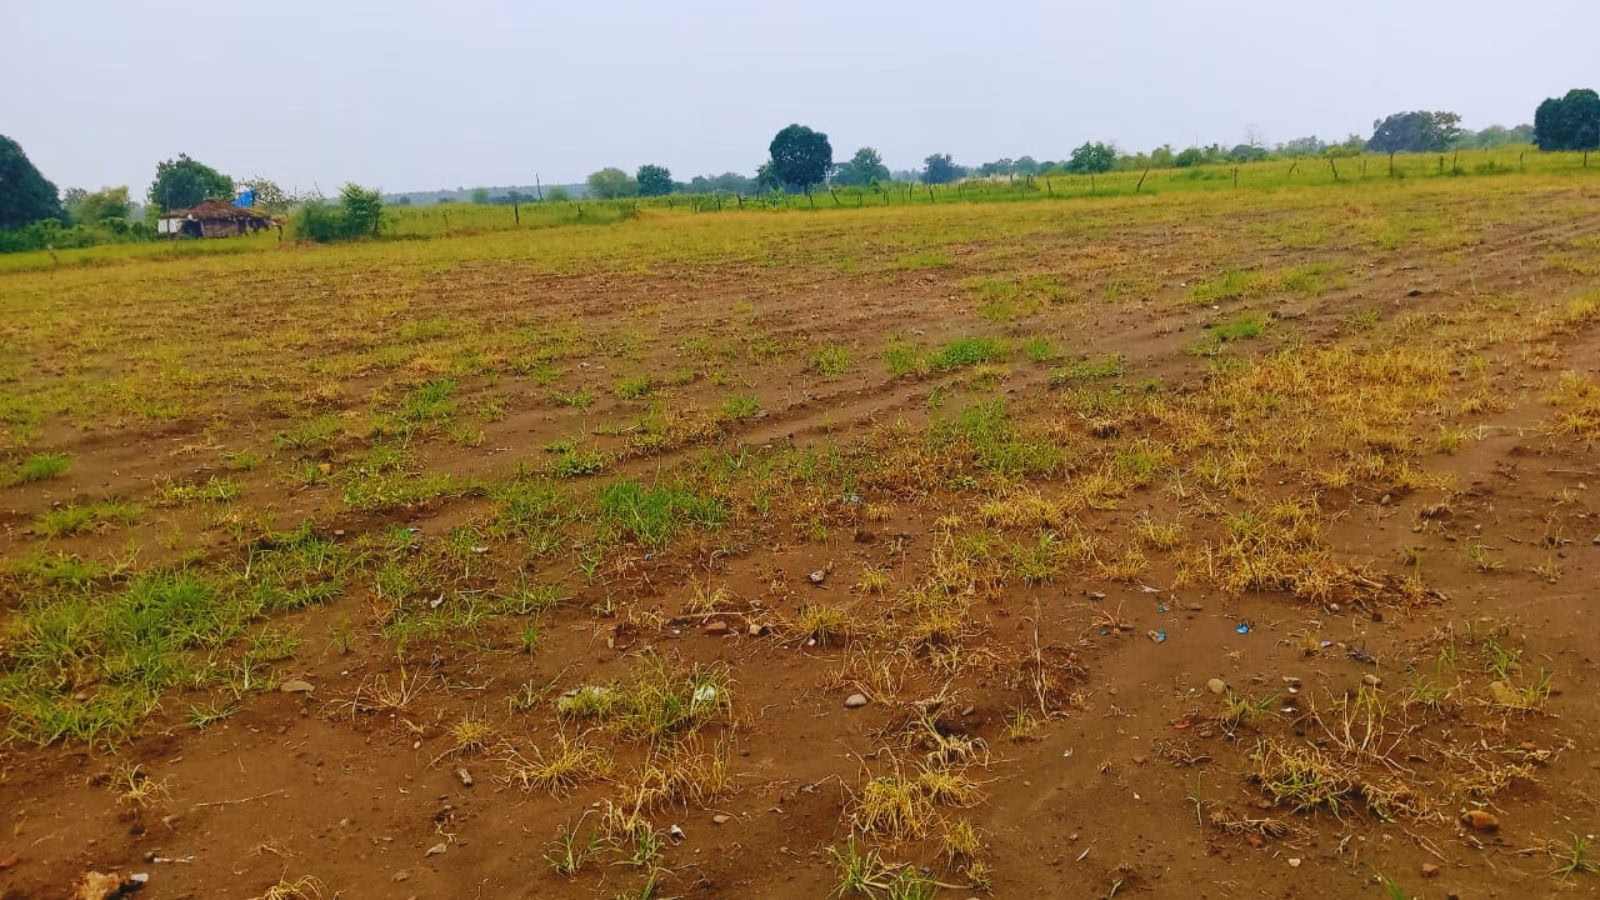
This year, too, the monsoon in India brought not the usual promise of prosperity but widespread destruction, as it has in recent years. Torrential rains flooded farmlands across several states, washing away livelihoods and submerging the hopes of millions of farmers. Instead of irrigating the fields, the rain turned into an unrelenting deluge. States like Punjab, Maharashtra, Bihar, Uttar Pradesh, and Madhya Pradesh experienced heavy flooding that claimed lives, displaced thousands, and devastated crops — a major blow to the country’s agricultural economy.
When rain becomes a curse
Madhya Pradesh, often called the “Heart of India,” has been particularly affected. Both floods and waterlogging have crippled agriculture. The monsoon began on June 16, and by the end of September, the state had received 119% of its average rainfall — 44.2 inches instead of the expected 37 inches, a 7.2-inch surplus.
In the Bundelkhand region, which spans parts of Madhya Pradesh and Uttar Pradesh, July’s rainfall broke a ten-year record. Sagar district recorded 471 mm, Tikamgarh 416 mm, Damoh 365 mm, Niwari 362 mm, and Chhatarpur 261 mm. The rain persisted through October, flooding villages and turning agricultural land into temporary lakes. Bundelkhand, already known for its fragile ecology and dependence on monsoon rains, saw crops submerged instead of nourished. The result: massive losses of yield and income.
The ground reality: Voices from the fields
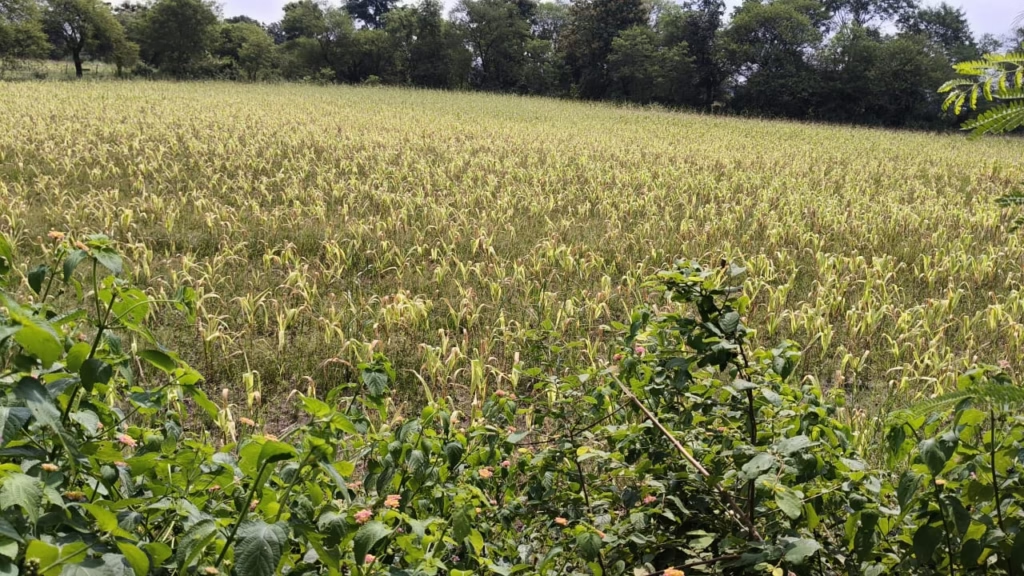
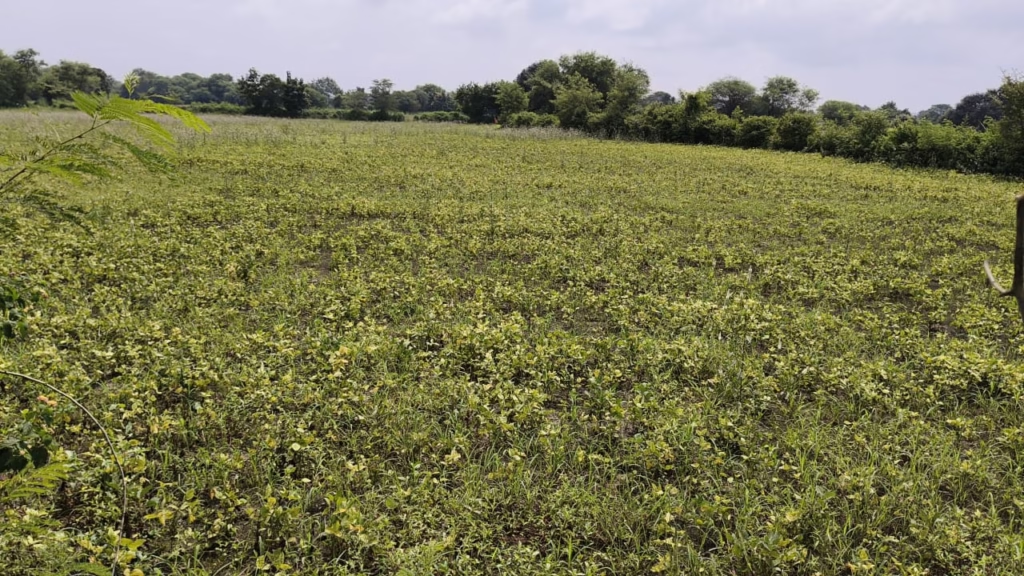
A glimpse of the devastation can be seen in the rural belt of Sagar district, where a majority of the population depends on agriculture. Kesli Tehsil, located about 65 km from Sagar city, is known for its fertile soil and green cover. But this year, the sight is heartbreaking — bent paddy stalks, rotting soybean pods, and maize that never reached maturity.
“Even clearing the field costs more than what we’ll earn.” In Chirai village, farmers are counting their losses. Arjun, a natural farming practitioner who owns about 12 acres, says, “Agriculture is the livelihood for all communities here — Brahmin, Thakur, Adivasi, Harijan, and Chadhar. The rains destroyed everyone’s crops. Even the ‘murum’ (gravelly) soil areas are damaged, and crops on black and yellow soil have been wiped out. Until July–August, everything looked promising. Then the rain washed away the crops — and our hopes. The damage is so severe that we won’t even recover the cost of clearing the fields. Farmers will now have to borrow money for the next crop. I fear many small farmers will leave their fields unsown.”
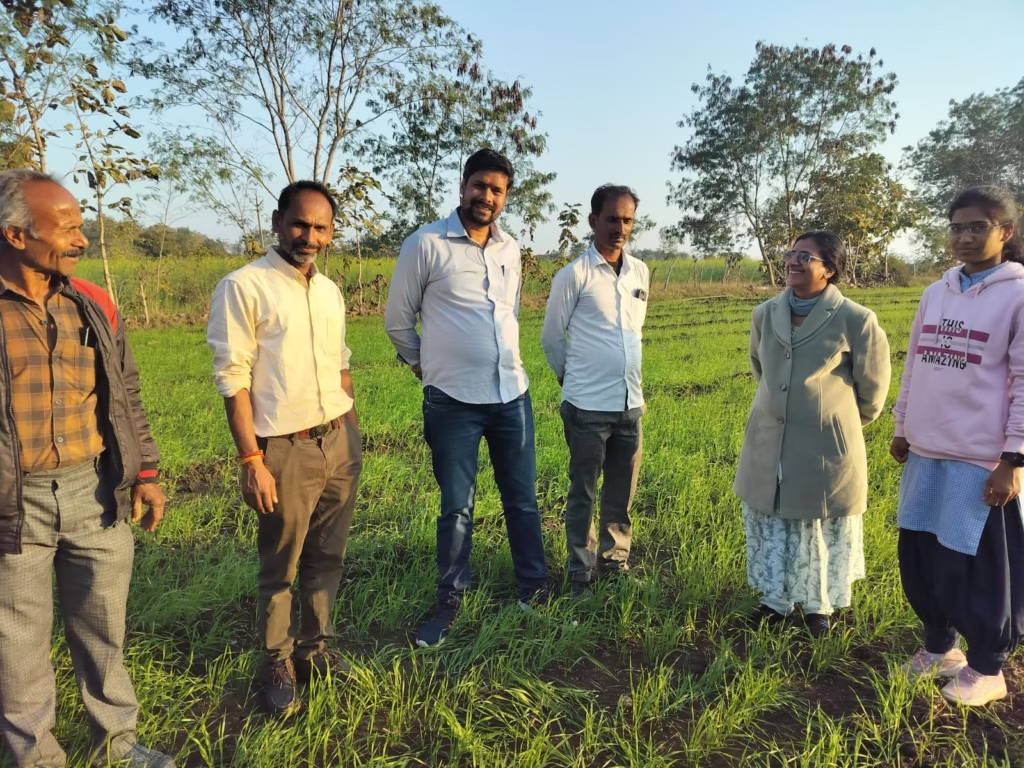
He paused before adding, “A farmer’s income mainly depends on two or three crops a year. Money comes only when we sell them. If the crops are ruined, how will we survive?”
“Our maize only grew three feet”

Sachin Thakur, another farmer from Chirai with 15 acres of land, shares, “I sowed soybean and maize. The soybean was mostly spoiled by the rain, and what remained dried up. The maize plants only grew three to four feet. Some cobs developed, but most plants had none, and the few cobs that did grow had fewer kernels. Nearby villages like Jaruwa, Bamni, Patna, Samnapur, Kukwara, and Mahka are all suffering the same fate.”
“The biodiversity of our fields is dying”
Ramji Thakur, also from Chirai and a member of the Bharatiya Kisan Sangh (Indian Farmers’ Union), explains: “We five brothers cultivate about 40 acres. This year we sowed maize, paddy, and soybean. All have been hit badly. The soybean is completely ruined — we’ll have to plough it back into the soil. Apart from the rain, the biodiversity of our crops and fields is also in danger. The government must take steps for conservation, inspection, and field development to preserve soil fertility and crop purity.”
“Only a little hope left for maize”
In Utkata village, Suresh Kumar Mehra manages 12 acres (four owned, eight leased).
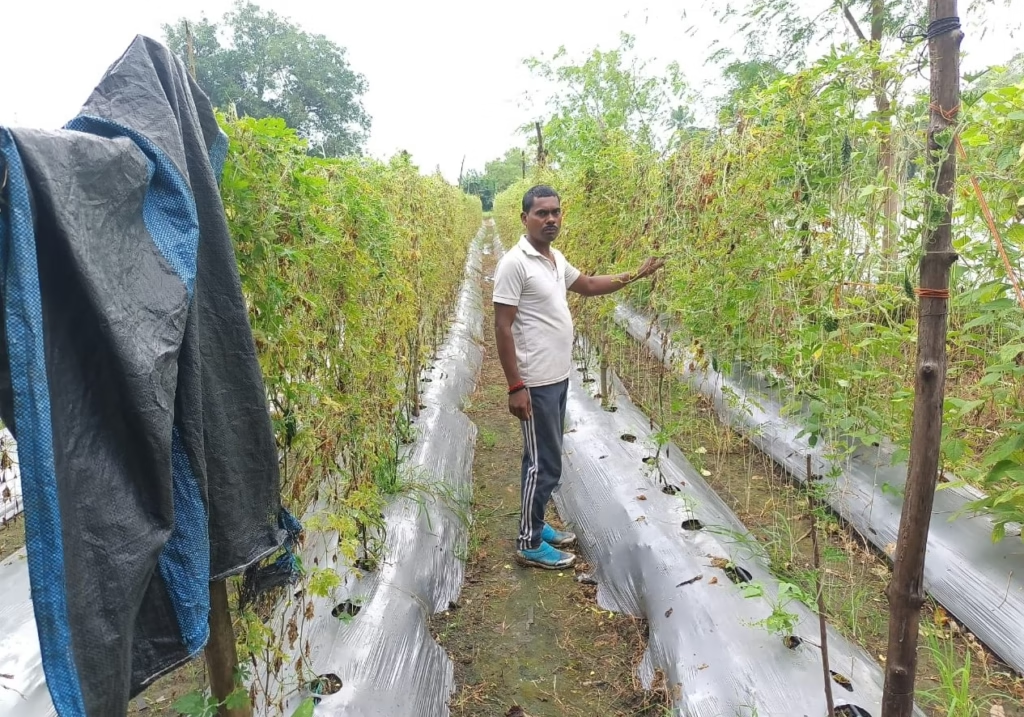
“I planted radish, sponge gourd, pigeon pea (tur), groundnut, and maize. Except for maize on two acres, everything was destroyed by rain and waterlogging. Only the maize gives me a little hope.”
“A fungus ruined our maize”
From Jetpur Doma village, Sitaram Patel says, “I have six acres, and my family has been farming for three generations. This time we grew bottle gourd and tomato, which survived. But maize around us is ruined. About 10% of it got a fungal disease because of waterlogging. The plants couldn’t withstand the rain.”
“Rs 40,000 gone—and nothing to show for it”

Govind Patel from Chauka village detailed his financial losses, “I sowed maize and pigeon pea on five acres. I spent around Rs 40,000 (approx. $480) on seeds, fertilizer, and chemicals. The pigeon pea is completely gone. Only maize might help me recover part of the cost. But most farmers nearby have maize that only grew two to two-and-a-half feet before turning yellow.”
“Only a third of our seeds sprouted”
Ajab Singh, a farmer from Kewlari Kalan, shares, “Here we have small and big farmers, and everyone’s crop is affected. We sowed paddy, soybean, and maize, but because of continuous rain and waterlogging, many seeds didn’t even sprout. In most fields, only about 25–30% of the seeds grew.”
He added that crops in surrounding villages like Kheri, Semra, Ghana, and Idalpur were also submerged.
“In low-lying areas, 90% of crops are gone”

Arvind Bhaiji, another Kesli farmer, says, “The flat and low-lying fields are more damaged, while crops in slightly elevated areas are better. Some crops are 50% damaged, others 70%, and some even 90% ruined. The rain caused root rot, and the urea fertilizer has been washed away. Farmers here have small landholdings and little money to manage rainwater.”
District Farmers’ Union: ‘Satellite surveys can’t see reality’
When contacted, Raghuvir Tomar, district president of the Bharatiya Kisan Sangh, says, “the situation of both crops and farmers is very bad. We are demanding that the government conduct an accurate survey and give compensation.”
He criticized the current assessment methods, “In some places, a satellite survey is being used, but it’s not accurate. It doesn’t show the condition of the kernels or the extent of the rot. The ground reality is much worse.”
Climate Change, adaptation, and farmer-led Solutions
As farmers struggle to rebuild, Akash Chaurasia, a nationally recognized innovator in sustainable agriculture, offers a hopeful path. Known for developing Multi-Layer Farming, Akash believes the situation is not hopeless — it just demands adaptation.
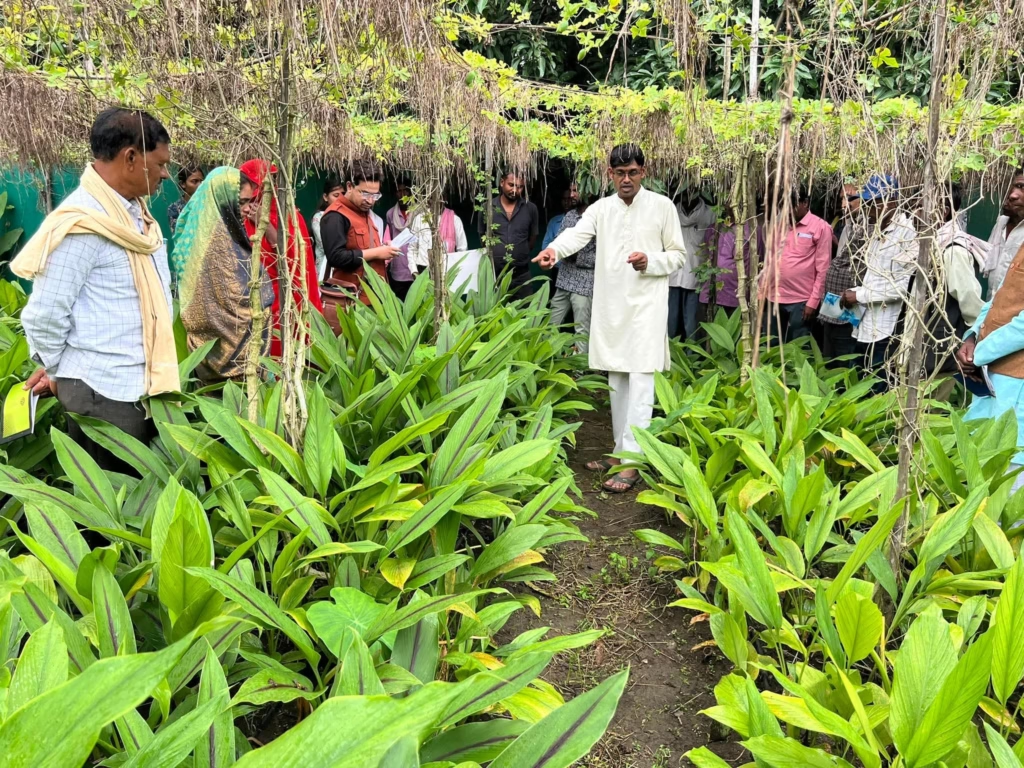
“This imbalance of excessive rain is a form of climate change,” he explains. “It’s a disruption that can destroy ecosystems if farmers don’t adapt. But solutions exist.”
His advice is straightforward and affordable:
1. Build Drainage Channels
“During heavy rain, farmers should dig a two-foot-deep and two-foot-wide drain around the raised boundary (med) of their field. This helps excess water escape into canals or pits. When water collects underground, it recharges groundwater and prevents soil erosion. Fertilizer won’t wash away, and waterlogging will end.”
2. Adopt Raised-Bed (Med) Sowing
“In the Med method, crops are sown four to five inches above the ground. When it rains, the water stays in the drains, not around the crop. This prevents root rot. Farmers can do this with their own labour — no extra money is needed. I’ve used it on my own farm, and our crops stay healthy even in heavy rain.”
Akash believes such simple practices, if widely adopted, could transform India’s vulnerability into resilience.
“If every farmer in waterlogged regions followed these two steps, we could save thousands of acres every year.”
Government Support — And What’s Still Missing
India has several schemes designed to protect farmers from disasters:
- Pradhan Mantri Fasal Bima Yojana (2016): Provides crop insurance and financial assistance during natural calamities.
- Pradhan Mantri Kisan Samman Nidhi Yojana (PM-KISAN, 2019): Offers Rs 6,000 (approx. $72) annually to farmers for basic support.
- Mukhyamantri Kisan Kalyan Yojana (2020): Adds another Rs 6,000 (approx. $72) per year from the state government.
Despite these, many farmers say the support arrives late or doesn’t cover losses. As Arjun pointed out, “We can’t wait months for relief when we have to buy seeds next week.”
Experts argue that while insurance and compensation help recovery, the real solution lies in prevention — teaching farmers low-cost water management, soil conservation, and climate-resilient methods.
Bringing science and policy Together
Agricultural scientists emphasize the importance of integrating climate-adaptive strategies into local farming practices. Soil moisture mapping, satellite-assisted flood prediction, and localized extension services can inform when to sow, which crops to prioritize, and how to manage water in extreme rainfall years.
What the farmers of Bundelkhand need is not just relief but resilience. Drainage systems, raised-bed cultivation, and better soil management can all help farmers cope with erratic rainfall
Bundelkhand’s case demonstrates a broader climate reality: traditional monsoon patterns no longer guarantee stable farming. What worked decades ago may fail today. Farmers, government agencies, and scientific institutions must collaborate to create resilient systems that protect crops, livelihoods, and the environment.
What the farmers of Bundelkhand need is not just relief but resilience. Drainage systems, raised-bed cultivation, and better soil management can all help farmers cope with erratic rainfall. Local governments could play a transformative role by integrating these ideas into training programs, agricultural extension services, and climate adaptation schemes.
The story of this year’s rain in Madhya Pradesh is one of loss — but also of learning. Farmers like Akash Chaurasia show that adaptation begins with awareness and small, practical steps. If those lessons spread across India’s rural heartland, future monsoons might once again bring prosperity, not panic. The monsoon, once India’s lifeline, is now becoming unpredictable under a changing climate. What farmers in Madhya Pradesh need most is not just compensation—but climate-smart solutions that can secure their future harvests.
(The story is part of EdPublica’s Solutions Journalism Initiative)







Earth
The Trees That Stand Between Mumbai and the Sea
How Mumbai’s mangroves became the city’s first line of defence against floods, climate change, and coastal collapse.

As the world marks the International Day for the Conservation of the Mangrove Ecosystem, Mumbai mangroves tell a story of survival, climate resilience, and lessons learned from the devastating 2005 floods. From Thane Creek to the Mithi River, these coastal forests reduce flood risk, store carbon, support marine biodiversity, and sustain millions of livelihoods. Yet despite legal safeguards and restoration efforts, pollution, infrastructure projects, and climate change continue to threaten one of India’s most valuable natural defences.
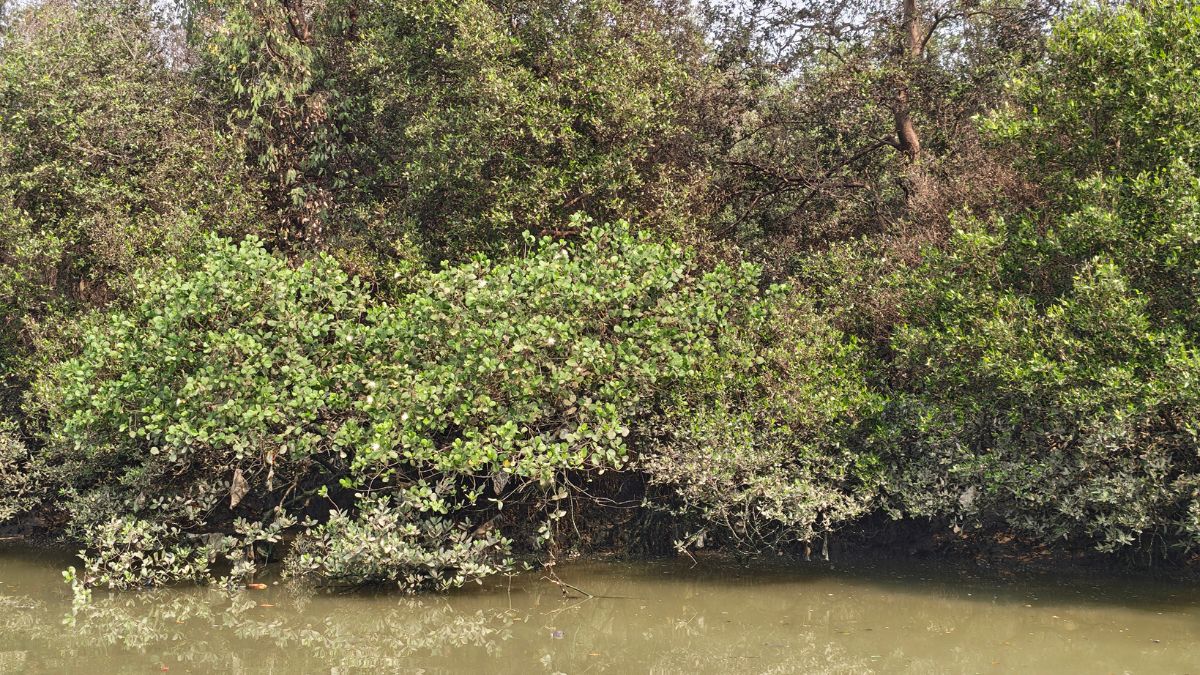
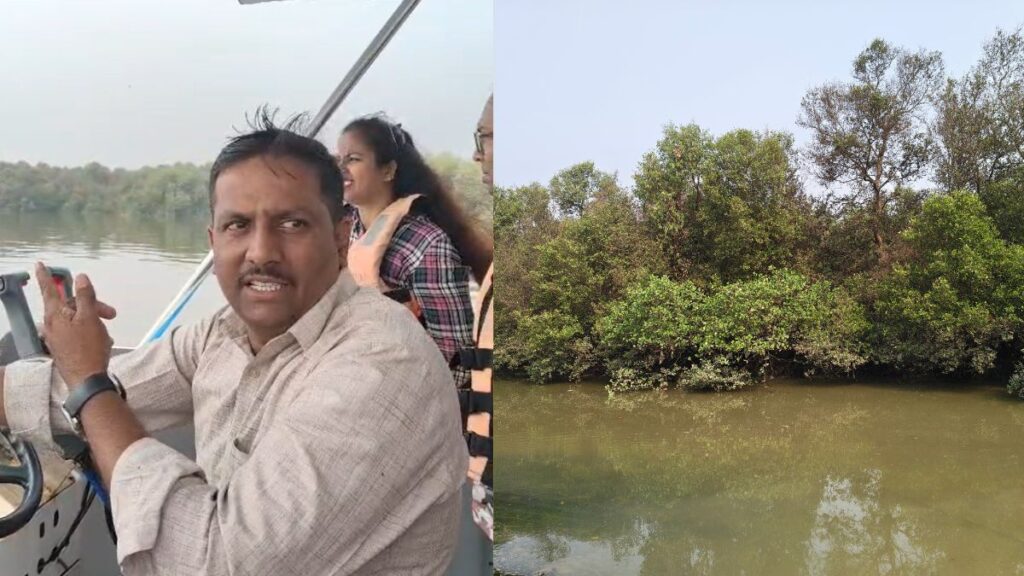
“This is Avicennia marina,” said Manish Zendeker, pointing to the trees lining the water as he steered his ferry through the narrow channels of the Thane Creek Flamingo Sanctuary. “In total, 17 species are found in Maharashtra. Overall, they are called mangroves, but among them, this is a distinct species. We see this more commonly here in Mumbai. If you go towards Ratnagiri, you will mostly see Sonneratia alba.” He went on, unprompted, into the mechanics of why the species in front of us mattered: “Its presence here is so important because it works to filter the creek water — it purifies it. Its roots go underwater and come back up, which are called pneumatophores, or breathing roots. Those roots have many tiny pores. When the high tide water comes in, their pores open up and absorb whatever pollution or chemicals are in the water. So that is its main benefit — it works to keep the creek water clean.”
What surprised our reporting team wasn’t that a boat driver on Thane Creek knew mangroves mattered — most people who live near them can tell you that much. It was the precision: a species name offered without hesitation, a north-south distinction between what grows here and what grows 300 kilometres south near Ratnagiri, a working theory of how the roots do their job, delivered from memory, between turns of the outboard motor. It was the kind of knowledge that usually lives in a research paper.
Today, 26 July, is the International Day for the Conservation of the Mangrove Ecosystem, a date the United Nations chose deliberately: it marks the anniversary of the 2005 Mumbai deluge, the day 944 millimetres of rain fell on the city in 24 hours and more than a thousand people died. The date is not a coincidence, and neither is the connection to Mumbai. What happened that day, and what has happened in the two decades since, is one of the clearest real-world demonstrations anywhere of what a mangrove forest is actually worth — and what a city pays when it disappears.
How mumbai mangroves protect the city from floods
By the time the 2005 floods hit, Mumbai had already spent roughly a decade quietly getting rid of its mangroves. Between the early 1990s and 2005, the city lost close to 40% of its mangrove cover — something in the range of 9,000 acres — much of it along the Mithi River, where the swampy, root-tangled land was drained and filled to build what is now the Bandra Kurla Complex, one of the city’s premier commercial districts. The Mithi itself, an 18-kilometre stormwater channel that carries overflow from Powai and Vihar lakes out to the Arabian Sea, had been narrowed, built over, and used for decades as an open drain for sewage and industrial waste.
When the rain came, the river had nowhere to put it. A 2018 hydrological case study of the Mithi River modelled what the mangrove loss actually cost the city in physical terms: intact mangrove forest along the riverbanks reduces flood wave height and cuts the inundation area by roughly 21%, by absorbing and slowing the surge before it reaches built-up land. Without that buffer, the 2005 floodwaters had nowhere to go but into the shops, homes, and railway lines of central Mumbai.
The flood changed the law almost immediately. Later that year, the Bombay High Court banned the destruction of mangroves on government land across Maharashtra and prohibited construction within 50 metres of any mangrove area, and by 2012 the state had set up a dedicated Mangrove Cell to enforce it. The reversal that followed is one of the more striking examples of legal protection actually working at scale: according to Forest Survey of India data, Mumbai’s own mangrove cover grew from 42 square kilometres in 2005 to 66 square kilometres by 2017, a 57% recovery. State-wide, Maharashtra’s mangrove cover more than kept pace, expanding from 186 square kilometres in 2013 to 320 square kilometres by 2019, according to the Mangrove Cell’s own figures.
That recovery is real, but it is not the whole story, and it is not evenly spread. Forest officials themselves have cautioned that a rising area figure can mask falling ecological quality — mangroves can be denser or thinner, healthier or stressed, without that showing up in a simple hectare count. And the growth has come alongside continuing, highly localised battles: mangrove clearance tied to the Navi Mumbai International Airport, the Jawaharlal Nehru Port Trust’s expansion, and the Mumbai Trans-Harbour Link have repeatedly ended up in court, with activists and the state’s own Mangrove Cell frequently on opposite sides of the same case. Nationally, the trend has also turned again: India lost an estimated 7.43 square kilometres of mangrove cover just since 2021, though that recent decline is concentrated in Gujarat and the Andaman and Nicobar Islands rather than in Mumbai itself. The net picture for the city is a genuine recovery, won directly by an emergency response to a specific disaster, that now has to be actively defended patch by patch rather than assumed to hold on its own.
The comparison that made the point hardest to argue with came from a single village. Nandakumar Pawar, a fisherman in Bhandup, a mangrove-fringed suburb in Mumbai’s north-east, has described being startled that his neighbourhood came through the 2005 deluge largely unscathed while the rest of the city drowned. A more than 800-hectare stretch of mangroves near his village had acted as exactly what mangroves are built to be — a sponge, absorbing the surge rather than passing it on to the houses behind it. Pawar went on to found Shree Ekvira Aai Pratishthan, a fishing-community organisation that today serves as caretaker of some 1,042 hectares of mangrove forest between Mulund and Vikhroli along Thane Creek, working with the state Forest Department on protection and restoration. Pawar, now in his sixties, also serves as president of the Maharashtra Small-Scale Traditional Fish Workers Union — one measure of how directly a single flood turned a fisherman into one of the city’s more persistent mangrove advocates.
Thane Creek: a working case study
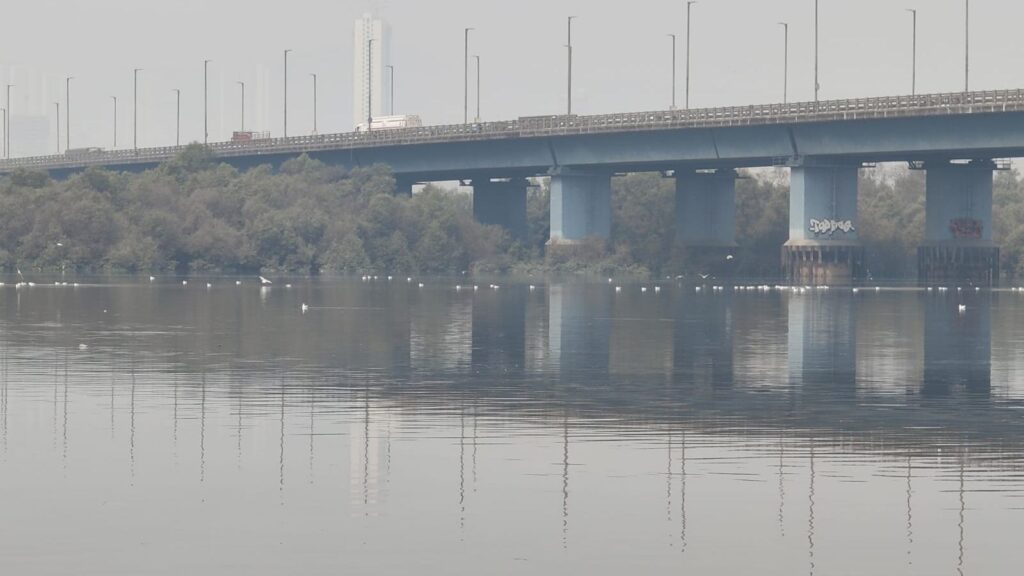
The waters our reporting team travelled — Thane Creek, Asia’s largest creek at 26 kilometres long — offer a live, ongoing version of this story rather than a historical one. The northern stretch of the creek was declared a flamingo sanctuary in 2015, protecting 1,690 hectares, of which 896 hectares are mangrove forest and the rest open water and mudflats. The creek has drawn over 30,000 migratory flamingos annually since the early 1990s, and by some counts accounts for close to a fifth of the mangrove species diversity found anywhere in India.
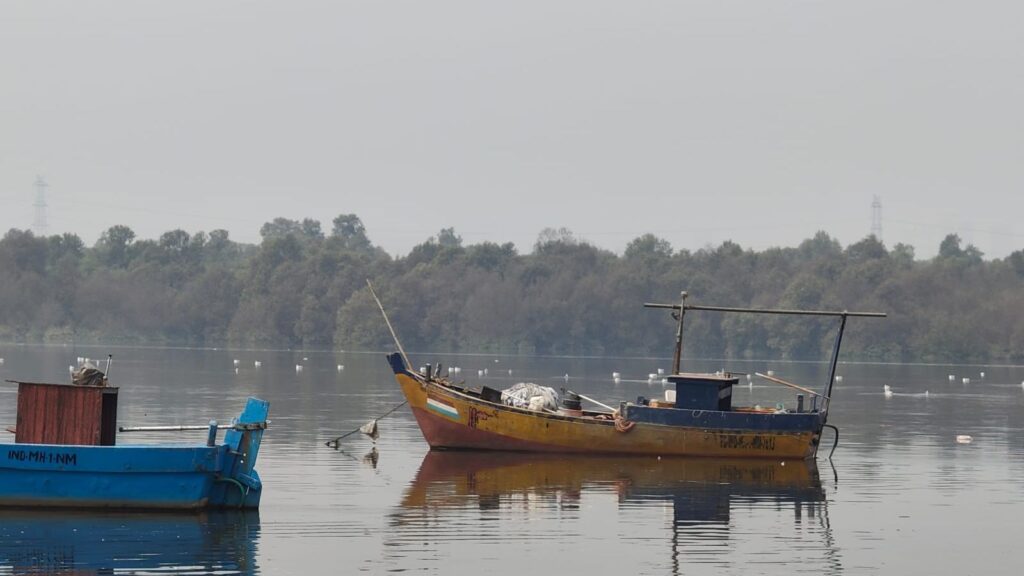
It is also a case study in what happens when mangroves are stressed rather than removed outright. Untreated sewage, industrial effluent, and construction runoff have degraded water quality across large stretches of the creek; one WWF-India assessment found that 58 of 69 marine species once recorded there have disappeared over a 14-year period, largely attributed to rising arsenic levels and falling oxygen content in the water. The sanctuary’s own mangroves have been the subject of repeated pollution complaints, including an industrial pipeline leak flagged by local fishermen in 2022. The lesson embedded in Thane Creek is that mangrove protection on paper — a sanctuary notification, a protected-area boundary — does not by itself guarantee a functioning ecosystem; the water quality and the tree cover have to be defended separately and continuously.
Restoration work has had some success. Community-led projects around Thane Creek and Mahim Bay have restored more than 100 hectares of mangrove cover in recent years, working with local fishing communities to combine habitat recovery with sustainable fishing practices and small-scale eco-tourism — the same boat tours that carried our reporting team through the sanctuary.
What the research says mangroves are worth, everywhere
Mumbai’s experience is a local instance of a pattern researchers have now quantified at a global scale, and the numbers are large enough to change how governments plan coastal defence.
A widely cited 2020 study published in Scientific Reports, led by researchers Pelayo Menéndez and Michael Beck, modelled the flood-protection value of every mangrove forest on Earth at 20-kilometre resolution and found that mangroves currently prevent more than US$65 billion in flood damage every year, and protect over 15 million people from flooding they would otherwise experience. A follow-up analysis, published in the World Bank’s Changing Wealth of Nations 2024 report, priced the total long-term value of that protection — the present value of a century of avoided flood damage — at US$855 billion globally. The countries that benefit most in absolute terms include China, Vietnam, the United States, Australia, and India; in terms of the sheer number of people protected, Vietnam, India, and Bangladesh top the list.
Mangroves do this largely through friction. Their dense, tangled root systems and low canopy break up wave energy and slow storm surge as it moves inland; the State of the World’s Mangroves 2024 assessment estimates that mangrove forests reduce flood depth by 15–20% compared with a coastline that has none.
The carbon case is, if anything, stronger. Mangrove soil is waterlogged and largely oxygen-free, which means the organic matter that collects in it barely decomposes — it simply stays there, sometimes for thousands of years. Researchers estimate mangroves store an average of 394 tonnes of carbon per hectare, split roughly 78% in the soil, 15% in above-ground biomass, and the rest below ground, figures that vary sharply by region: forests in Southeast Asia and the Philippines can exceed 650 tonnes per hectare, while carbon density in parts of the Middle East falls below 100. Even though mangroves cover under 1% of the world’s tropical forest area, one estimate puts their total global carbon stock at around 6.5 billion tonnes — the single largest carbon pool of any blue carbon ecosystem, ahead of seagrass meadows and salt marshes combined in density per hectare, if not in total area.
None of this is guaranteed to last. The global rate of mangrove loss has slowed — from roughly 1% a year in the 1990s to about 0.66% a year between 2010 and 2020, and the FAO’s 2025 Global Forest Resources Assessment even found a net global gain since 2010, reversing decades of decline — but a 2024 assessment by the International Union for Conservation of Nature found that more than half of the world’s mangrove ecosystem types are still at risk of collapse by 2050 if current pressures continue, a category that includes South India’s mangroves specifically, which the IUCN has already classified as critically endangered. Area recovering is not the same as risk disappearing; it mainly means the fight has shifted from outright clearance to slower, harder-to-see pressures — pollution, aquaculture expansion, and the kind of localised infrastructure disputes already playing out around Mumbai.
Governments have started responding at the scale the research implies is necessary. At COP28 in 2023, the Mangrove Breakthrough initiative set a global target of restoring or protecting 15 million hectares of mangrove forest by 2030, backed by a proposed US$4 billion in financing — an explicit bet that the cost of restoration is small next to the avoided cost of flooding, storm damage, and lost carbon storage that follows when mangroves disappear.
What the boat driver already knew
None of this would have surprised the man steering the boat through Thane Creek. Long before any of these studies were published, people who live beside mangrove forests — fishermen in Bhandup, boat operators on the creek, families along the Mithi’s banks — had already worked out, through direct experience, what the data now confirms with figures: that the trees standing between them and the water were doing something that mattered, long before anyone put a price on it.
Mumbai’s flood risk has not gone away since 2005, even though its mangrove cover has, on paper, come back. Sea levels are rising, monsoon rainfall is becoming more erratic and more intense, and the city’s population and built footprint keep expanding into the same low-lying, once-swampy land that used to absorb the water. The mangroves that have grown back — in Thane Creek, along Mahim Bay, in the restored patches near the Mithi — are doing exactly the job the research describes: quietly absorbing surge, filtering pollutants, and storing carbon. Whether they keep doing it depends less on whether the trees are allowed to grow than on whether anyone keeps watching, largely unnoticed, until the next storm makes their condition impossible to ignore.
Earth
The Silent Collapse Beneath Our Feet: India’s Earthworm Crisis
Earthworms – nature’s unseen soil engineers – are vanishing across India. Their decline signals a deeper ecological breakdown, with far-reaching conseque-nces for agriculture, climate resilience, and national food security


Earthworms are among the most critical yet overlooked “soil engineers” of terrestrial ecosystems. Despite their foundational role, the systematic neglect of soil biodiversity in agricultural policy represents a serious strategic blind spot. Across India, an invisible crisis is unfolding as earthworm populations decline sharply in both agricultural and natural landscapes. This is not merely a biodiversity concern—it is a direct threat to the country’s soil capital and long-term food security.
As foundational organisms, earthworms provide the biological infrastructure necessary for ecological balance. Their disappearance reflects a deeper structural failure in land management systems and calls for a closer examination of their biological and ecological functions.

The Foundational Role: How Earthworms Sustain Productivity
In modern agronomy, healthy earthworm populations are a prerequisite for sustainable productivity. These organisms create a living soil architecture that no mechanical intervention can replicate. By processing organic matter, they act as a bridge between decomposing waste and plant-available nutrients, ensuring both chemical fertility and physical stability.
“The decline in earthworm populations reflects a deeper crisis in human–environment interactions,” says Sreelakshmy.M, Assistant Professor, Geography, Nirmala College, Coimbatore, Tamil Nadu. “From a geographical perspective, this issue is not merely biological but spatial and systemic, rooted in the transformation of land, climate, and soil regimes.”
The intensification of agriculture since the Agricultural Revolution has fundamentally altered soil ecosystems. While synthetic fertilizers and pesticides have boosted yields in the short term, they have imposed significant ecological costs. Earthworms, particularly those inhabiting the topsoil, are directly exposed to these chemical inputs. Their decline signals a broader degradation of soil health, as they are key agents of aeration, nutrient cycling, and organic matter decomposition.
When topsoil biodiversity diminishes, the long-term fertility and structural integrity of agricultural landscapes are compromised.
Equally significant is the rapid transformation of land-use patterns. Urban expansion, infrastructure development, and the spread of impermeable surfaces have led to soil sealing and habitat fragmentation. From a spatial perspective, the conversion of biologically active land into built environments represents a permanent loss of ecological function. Earthworms cannot survive beneath concrete, and with their disappearance, essential soil processes are disrupted.
Core Contributions to Soil Vitality
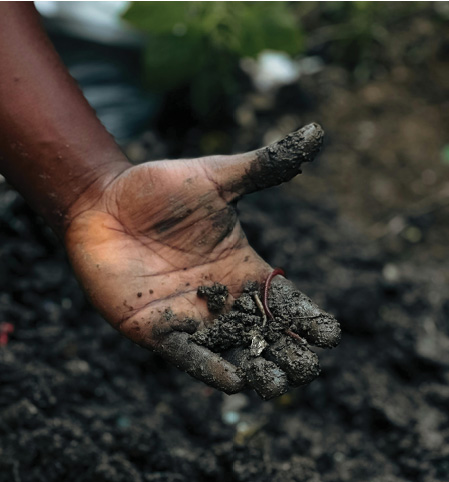
Earthworms play a central role in maintaining soil health. Their burrowing creates complex underground networks that improve soil structure, enhance aeration, and enable deeper root penetration. These tunnels also stimulate microbial activity, strengthening the soil’s biological ecosystem.
By digesting organic matter, earthworms convert decomposing residues into nutrient-rich castings. These natural fertilizers contain concentrated levels of nitrogen, phosphorus, and potassium—essential elements for plant growth. Through this continuous recycling process, they sustain the nutrient base of agricultural systems.
In addition, earthworms bind soil particles into stable aggregates, improving water infiltration and moisture retention. This reduces surface runoff, protects against erosion, and enhances resilience to extreme weather conditions.
Together, these processes form the backbone of agricultural stability. Yet, modern human-driven pressures are rapidly eroding this biological foundation.
“Rising global temperatures increase soil heat and accelerate moisture evaporation,” Sreelakshmi explains. “Earthworms depend on a delicate balance of temperature and moisture. When soils dry or overheat, survival becomes difficult, often leading to localized mass mortality.”
This decline illustrates the interconnected nature of environmental stressors—chemical intensification, land-use change, and climate shifts—operating simultaneously across scales.
Analyzing the Drivers of Decline: A Multi-Front Threat
The shift from traditional Indian farming—once characterised by organic inputs, mixed cropping, and minimal disturbance—to intensive industrial agriculture has created increasingly hostile conditions for soil life. The decline of earthworms is driven by multiple, overlapping pressures:
Chemical Toxicity: The extensive use of urea-based fertilizers, pesticides, and fungicides introduces toxic compounds into the soil. Many of these act as neurotoxins, impairing earthworms’ nervous systems and reducing their reproductive capacity.
Nutritional Depletion: Practices such as stubble burning and the removal of crop residues deprive soil organisms of organic matter, their primary food source.
Mechanical Disturbance: Frequent tillage and heavy machinery disrupt soil structure, destroy burrow networks, and cause compaction, limiting oxygen availability.
Habitat Erosion: Deforestation and poor land management accelerate topsoil loss, eliminating the primary habitat where earthworms thrive.
Climate Stress: Rising temperatures, erratic rainfall, droughts, and flooding create unstable and often lethal conditions for moisture-sensitive organisms.
According to Dr. C P Maruthamalai, Assistant Professor, Geology,
Madurai Kamaraj University, the intensive use of chemical inputs significantly disrupts soil ecosystems. Excess nitrogen alters soil chemistry, creating conditions hostile to beneficial organisms. Prolonged exposure reduces earthworm mobility, feeding ability, and reproduction, gradually weakening entire populations.
These stressors are no longer isolated—they form a systemic crisis that is reshaping agricultural landscapes.
The Domino Effect: Systemic Consequences of Decline
The disappearance of earthworms triggers a cascading “domino effect” across ecological and economic systems, transforming agriculture from a self-sustaining biological model into a fragile, input-dependent system.
Declining Natural Fertility: Reduced decomposition slows nutrient cycling, forcing farmers to rely increasingly on synthetic fertilizers, often leading to rising input costs.
Weakened Soil Structure: Compacted soil restricts root growth and reduces water efficiency, making crops more vulnerable to stress.
Water Instability: Lower infiltration rates increase runoff, contributing to both drought conditions and soil erosion.
Food Security Risks: As soil productivity declines, crop yields become less stable, threatening long-term food systems.
Biodiversity Collapse: Earthworms are central to the soil food web; their disappearance disrupts microorganisms and higher organisms alike, leading to broader ecological breakdown.
This systemic decline underscores the fragility of current agricultural practices.
Rebuilding Soil Health
Addressing this crisis requires a fundamental shift in agricultural thinking—from short-term chemical dependency to long-term ecological restoration. Earthworms must be recognised as key indicators of soil health.
Strategic priorities include:
1. Transitioning to organic and natural farming systems
2. Restoring soil organic matter through compost, green manure, and vermicompost
3. Adopting conservation agriculture and reducing tillage
4. Eliminating stubble burning and promoting residue retention
5. Integrating soil biodiversity into agricultural policy and extension services
Such measures are essential not only for restoring earthworm populations but also for rebuilding resilient farming systems.
An Imperative for the Future
The decline of earthworms is a warning signal of a deeper ecological imbalance within India’s landscapes. Protecting these silent engineers is not simply an environmental concern—it is central to economic stability, agricultural sustainability, and national food security.
A resilient future depends on restoring the biological life of our soils.
Because the future of farming does not begin in laboratories or markets—it begins beneath our feet.
Climate
The Next Five Years Could Be Earth’s Hottest Yet, WMO Warns
A new WMO forecast warns that Earth could see new global temperature records before 2030, with Arctic warming continuing to outpace the global average.

Global temperature record levels are likely to be challenged again before the end of this decade, according to a new World Meteorological Organization forecast. Scientists say there is a high chance that one of the next five years will become the warmest ever recorded, as rising greenhouse gas emissions and a possible El Niño event continue to push the planet toward new climate extremes.
The world is heading into another stretch of exceptional heat, with a strong chance that a new global temperature record will be set before the end of the decade.
According to a new assessment from the World Meteorological Organization (WMO), global temperatures are expected to remain at or near record levels between 2026 and 2030, extending a warming trend that has already pushed climate indicators into uncharted territory.
The report paints a picture of a planet that continues to warm despite international efforts to curb greenhouse gas emissions. While the Paris Agreement aims to limit long-term warming to 1.5°C above pre-industrial levels, scientists now estimate there is a 91% chance that at least one of the next five years will temporarily cross that threshold.
Global Temperature Record Could Be Broken Again by 2030
Even more striking, there is a 75% chance that the average temperature across the entire five-year period from 2026 to 2030 will exceed 1.5°C above pre-industrial levels.
The findings do not mean the Paris Agreement has officially failed. The agreement’s temperature targets are measured over decades rather than individual years. Still, climate scientists view the growing frequency of these temporary breaches as a sign of how rapidly the planet is approaching those long-term limits.
The report projects annual global temperatures during 2026–2030 to range between 1.3°C and 1.9°C above the 1850–1900 average. There is also an 86% chance that one of those years will surpass 2024, currently the warmest year ever recorded.
One factor behind the forecast is the likely return of El Niño conditions in the tropical Pacific Ocean.
2027 Could Become the Next Global Temperature Record Year
Dr. Leon Hermanson, lead author of the report, said: “There is an El Niño predicted for the end of 2026, which increases the chances of the following year, 2027, being the next record-breaking year.”
El Niño events typically raise global temperatures by releasing additional heat from the Pacific Ocean into the atmosphere. When combined with the long-term warming caused by greenhouse gas emissions, they can push global temperatures to new highs.
Global Temperature Record Highlights Faster Arctic Warming
While rising temperatures affect every region, the Arctic continues to stand out.
The WMO forecasts that Arctic temperatures during the next five northern hemisphere winters will average about 2.8°C above the 1991–2020 baseline. That is more than three times the projected global average anomaly over the same period.
Scientists have long observed that the Arctic is warming faster than the rest of the world, a phenomenon known as Arctic amplification. The consequences include shrinking sea ice, thawing permafrost and disruptions to weather patterns far beyond the polar region.
The report also points to continued declines in sea ice across parts of the Arctic, particularly in the Barents Sea, Bering Sea and the Sea of Okhotsk.
A Wetter North, A Drier South
The warming climate is also reshaping rainfall patterns.
According to the forecast, northern high-latitude regions are likely to experience wetter-than-average winters over the next five years. Increased rainfall is also expected across parts of the tropics.
At the same time, many subtropical regions are projected to become drier. The Amazon is among the areas where below-average rainfall is considered more likely during the coming years.
Seasonal forecasts for 2026–2030 suggest wetter conditions in the Sahel region of Africa, northern Europe, Alaska and Siberia. Such shifts are consistent with what climate scientists have long expected in a warming world, where a warmer atmosphere holds more moisture and alters long-established rainfall patterns.
Beyond Records
The report is not simply about whether another temperature record will be broken.
For governments, businesses and communities, the findings serve as a reminder that climate change is increasingly shaping everyday realities—from agriculture and water supplies to infrastructure, health and disaster preparedness.
The assessment was produced by the UK Met Office on behalf of the WMO and draws on forecasts from 13 international climate centres. Scientists say confidence in the temperature projections is high because similar forecasting systems have performed well when tested against past climate conditions.
If the projections prove accurate, the second half of this decade could become a defining period in the world’s climate story—not because warming suddenly accelerates, but because the consequences of a steadily warming planet become harder to ignore.


Sarnath Becomes India’s 45th UNESCO World Heritage Site. Here’s Why the Recognition Matters

Monsoon Intensifies Across 10 States as IMD Issues Heavy Rain Alert

Sonam Wangchuk and the Long Story of Starving for a Cause

The Trees That Stand Between Mumbai and the Sea

Can Integrated Clean Energy Reshape India’s Steel Industry?

The 2026 Fields Medals: Four Proofs, Four Decades-Old Problems Solved

West Asia Crisis: Can Kerala’s Returning Gulf Migrants Find a Future in the Green Economy?

What Is Civilisational Diplomacy? Understanding India’s Newest Foreign Policy Tool

Sharing Over Shopping: How Kerala’s Swap House Is Modelling a Different Way to Consume

Every Rumble Sounds Like the Mountain Falling Again: Inside Meppadi’s Second Landslide in Two Years

-

 Math3 days ago
The 2026 Fields Medals: Four Proofs, Four Decades-Old Problems Solved
-
Society3 weeks ago
West Asia Crisis: Can Kerala’s Returning Gulf Migrants Find a Future in the Green Economy?
-
Space & Physics2 months ago
India Semiconductor Mission: ‘It’s Not About Fabs. It’s About Building An Entire Ecosystem’
-
Climate2 months ago
The Climate World Cup? How Climate Change Could Affect Player Performance at the 2026 World Cup
-
Society2 weeks ago
What Is Civilisational Diplomacy? Understanding India’s Newest Foreign Policy Tool
-
Society1 month ago
From Bell Labs to the Classroom: A Second Career in Teaching
-
Space & Physics2 months ago
Engineers Develop Dual-Mode Propulsion System for Next-Generation Small Satellites
-
Sustainability3 weeks ago
Sharing Over Shopping: How Kerala’s Swap House Is Modelling a Different Way to Consume