Society
How Scientists and Investigators Decode Air Crashes — The Black Box and Beyond
The final report may take months, but it will be critical in issuing safety directives or revising standard procedures.

As rescue and recovery operations continue following the June 12, 2025, plane crash in Ahmedabad, aviation safety experts are now focusing on the technical investigation phase. With 241 lives lost, the search for the cause isn’t just about accountability—it’s about prevention.
The Black Box: Aviation’s Memory Keeper
1. What Is the Black Box?
Despite the name, the black box is actually orange — for visibility. It consists of two components:
- Cockpit Voice Recorder (CVR): Captures conversations and audio from the flight deck.
- Flight Data Recorder (FDR): Logs dozens to hundreds of parameters — speed, altitude, engine status, control inputs.
These devices are housed in titanium or steel and can withstand:
- Temperatures above 1,000°C
- Underwater pressures up to 20,000 feet
- Crashes with up to 3,600 G-force
They also emit underwater locator beacons for up to 30 days.
2. Forensic Engineering & Flight Reconstruction
Beyond black boxes, investigators use:
- Radar data and air traffic control logs
- Wreckage analysis for structural failure clues
- Satellite-based tracking systems like ADS-B
- Weather data for turbulence or wind shear insights
Forensic teams often reconstruct the flight path virtually or even physically using recovered debris to determine failure points.
3. Human Factors & AI in Modern Investigation
New tools like machine learning and human factors analysis are used to identify procedural errors or lapses in judgement.
In many modern investigations, AI helps:
- Filter large datasets (e.g., over 1,000 flight parameters per second)
- Detect patterns missed by the human eye
- Predict similar risk scenarios in future flights
What Happens Next in the Ahmedabad Crash?
Authorities, in coordination with the Directorate General of Civil Aviation (DGCA), are likely:
- Retrieving and analyzing the black box
- Interviewing air traffic controllers
- Reconstructing the aircraft’s final seconds using both data and simulation
The final report may take months, but it will be critical in issuing safety directives or revising standard procedures.
Society
The Dragon and the Elephant Dance for a Cleaner World
New reports from the IEA and Ember show that China and India are leading a global turning point — where renewables now outpace fossil fuels.
In late September, EdPublica reported an inspirational story from Perinjanam, a quiet coastal village in the South Indian state Kerala, where rooftops gleam with solar panels and homes have turned into micro power plants. It was a story of how ordinary citizens, through community effort and government support, took part in a just energy transition.
That local story, seemingly small, was in fact a mirror of a far bigger movement unfolding worldwide. Now, two major global reports–one from the International Energy Agency (IEA) and another from the independent think tank Ember–confirm that the world is entering a decisive new phase in its energy transformation. Together, their findings show that 2025 is shaping up to be the turning point year: the moment when renewables not only surpassed coal but began meeting all new global electricity demand. The year will likely be remembered as the moment when the global energy transition stopped being a promise and became a measurable reality — led by the two Asian giants, China and India.
The Global Picture: IEA’s Big Forecast
‘The IEA’s Renewables 2025’ report, released on October 7, paints an extraordinary picture of growth and possibility. Despite global headwinds — including high interest rates, supply chain bottlenecks, and policy shifts — renewable energy capacity is projected to more than double by 2030, adding 4,600 gigawatts (GW) of new renewable power.
To grasp that number: it’s equivalent to building the entire current electricity generation capacity of China, the European Union, and Japan combined.
At the centre of this boom is solar photovoltaic (PV) technology, which will account for around 80% of the total growth. The IEA calls solar “the backbone of the energy transition,” driven by falling costs, faster permitting processes, and widespread adoption across emerging economies. Wind, hydropower, bioenergy, and geothermal follow closely behind, expanding capacity even as global systems adapt to higher shares of variable power.
“The growth in global renewable capacity in the coming years will be dominated by solar PV – but with wind, hydropower, bioenergy and geothermal all contributing, too,” said Fatih Birol, Executive Director of the IEA. “As renewables’ role in electricity systems rises in many countries, policymakers need to play close attention to supply chain security and grid integration challenges.”
The IEA forecasts particularly rapid progress in emerging markets. India is set to become the second-largest renewables growth market in the world, after China, reaching its ambitious 2030 targets comfortably. The report highlights new policy instruments — such as auction programs and rooftop solar incentives — that are spurring confidence across Asia, the Middle East, and Africa.
In India, the expansion of corporate power purchase agreements, utility contracts, and merchant renewable plants is also driving a quiet revolution, accounting for nearly 30% of global renewable capacity expansion to 2030.
At the same time, challenges remain. The IEA points to a worrying concentration of solar PV manufacturing in China, where over 90% of supply chain capacity for key components like polysilicon and rare earth materials is expected to remain by 2030.
Grid integration is another bottleneck. As solar and wind grow, many countries are already facing curtailments — when renewable power cannot be fed into the grid due to overload or mismatch in demand. The IEA stresses the need for urgent investment in transmission infrastructure, storage technologies, and flexible generation to prevent this momentum from being wasted.
Evidence on the Ground
If the IEA’s report is a map of where we’re going, Ember’s Mid-Year Global Electricity Review 2025 shows where we are right now — and the signs are unmistakable.
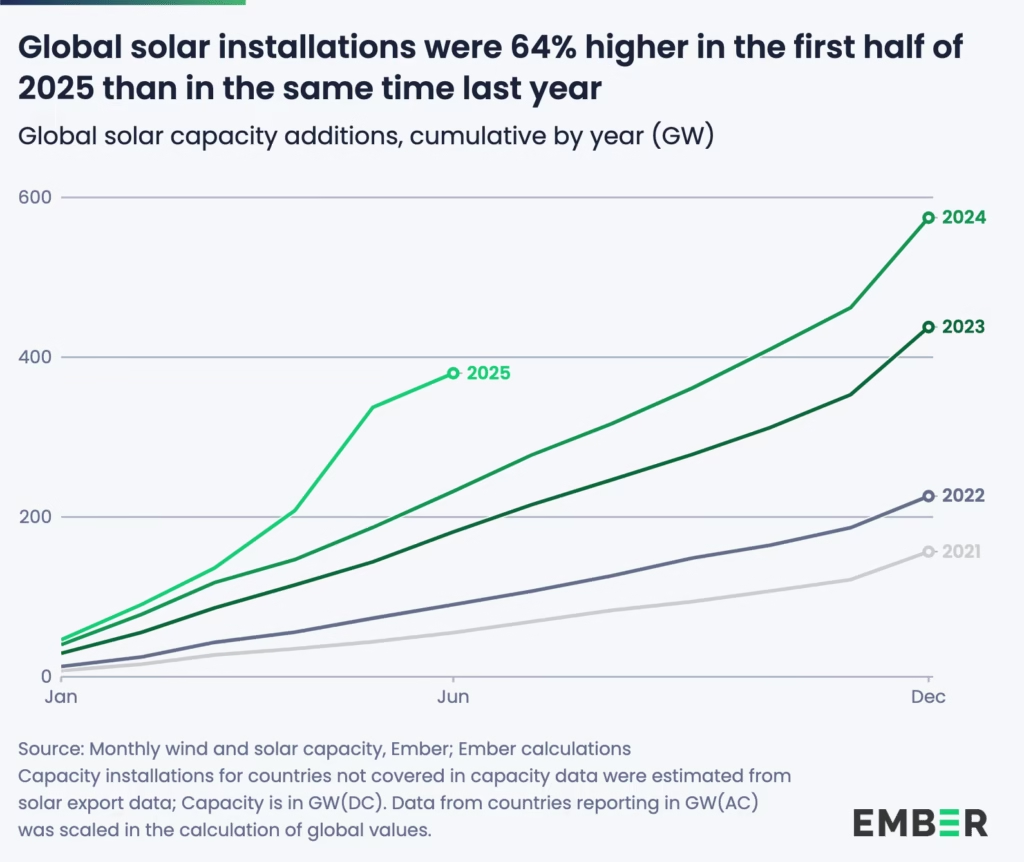
Ember’s data, covering the first half of 2025, reveals that solar and wind met all of the world’s rising electricity demand — and even caused a slight decline in fossil fuel generation. It’s a first in recorded history.
“We are seeing the first signs of a crucial turning point,” said Małgorzata Wiatros-Motyka, Senior Electricity Analyst at Ember. “Solar and wind are now growing fast enough to meet the world’s growing appetite for electricity. This marks the beginning of a shift where clean power is keeping pace with demand growth.”
Global electricity demand rose by 2.6% in early 2025, adding about 369 terawatt-hours (TWh) compared with the same period last year. Solar alone met 83% of that rise, thanks to record generation growth of 306 TWh, a year-on-year increase of 31%. Wind contributed another 97 TWh, leading to a net decline in both coal and gas generation.
Coal generation fell 0.6% (-31 TWh) and gas 0.2% (-6 TWh), marking a combined fossil decline of 0.3% (-27 TWh). As a result, global power sector emissions fell by 0.2%, even as demand continued to grow.
Most significantly, for the first time ever, renewables generated more power than coal. Renewables supplied 5,072 TWh, overtaking coal’s 4,896 TWh — a symbolic but historic milestone.
“Solar and wind are no longer marginal technologies — they are driving the global power system forward,” said Sonia Dunlop, CEO of the Global Solar Council. “The fact that renewables have overtaken coal for the first time marks a historic shift.”
China and India Lead the Way
The two reports together highlight that the epicenter of the clean energy shift is now in Asia.
According to Ember, China’s fossil generation fell by 2% (-58.7 TWh) in the first half of 2025, as clean power growth outpaced rising electricity demand. Solar generation jumped 43% (+168 TWh), and wind grew 16% (+79 TWh), together helping cut the country’s power sector emissions by 1.7% (-47 MtCO₂).
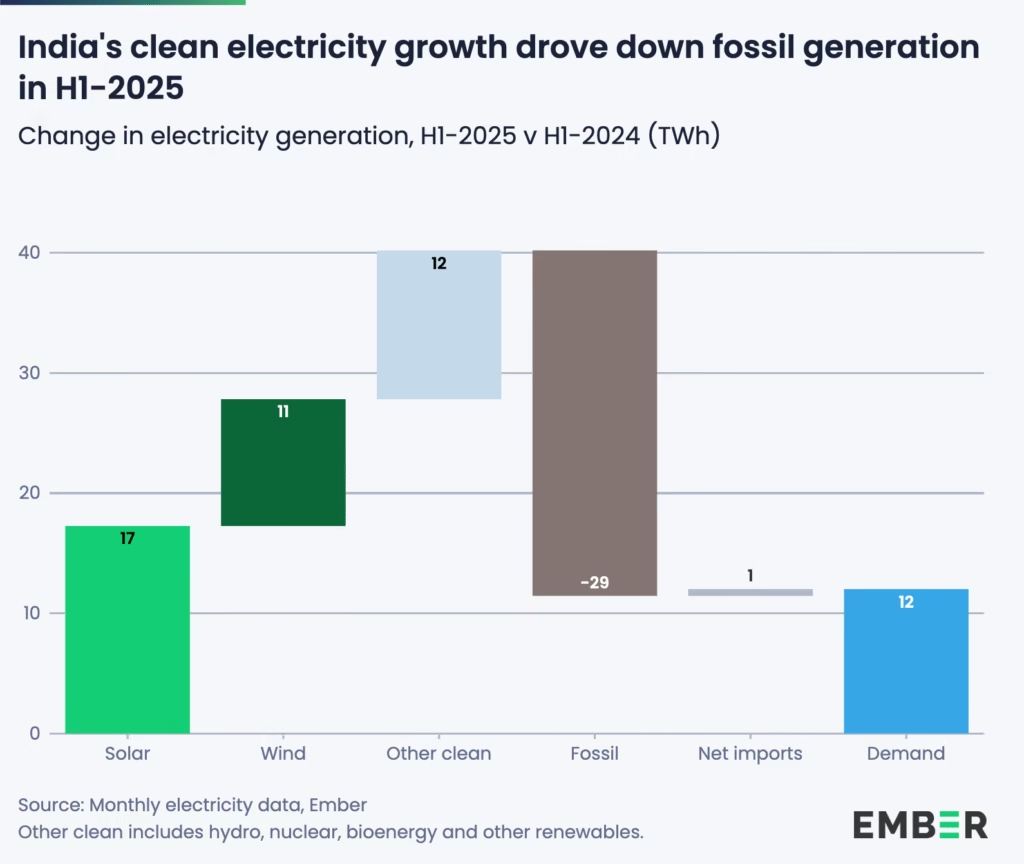
Meanwhile, India’s fossil fuel decline was even steeper in relative terms. Solar and wind generation grew at record pace — solar by 25% (+17 TWh) and wind by 29% (+11 TWh) — while electricity demand rose only 1.3%, far slower than in 2024. The result: coal use dropped 3.1% (-22 TWh) and gas by 34% (-7 TWh), leading to an estimated 3.6% fall in power sector emissions.
For both countries, these numbers align closely with the IEA’s projections. Together, China and India are now the primary engines of renewable capacity growth, demonstrating how large emerging economies can pivot toward clean energy while maintaining development momentum.
Setbacks Elsewhere
Yet progress is uneven. In the United States and European Union, fossil generation actually rose in early 2025.
In the U.S., a 3.6% rise in demand outpaced clean power additions, leading to a 17% increase in coal generation (+51 TWh), though gas use fell slightly. The EU also saw higher gas and coal use due to weaker wind and hydro output.
The IEA attributes part of this slowdown to policy uncertainty, especially in the U.S., where an early phase-out of federal tax incentives has reduced renewable growth expectations by almost 50% compared to last year’s forecast. Europe’s problem is different — a mature but strained grid facing seasonal fluctuations and low wind output.
These regional discrepancies underscore the IEA’s core message: achieving a clean power future isn’t just about building more solar farms, but about building smarter systems — integrated, flexible, and resilient.
Beyond Power
Both reports agree that while renewables are transforming electricity, their impact on transport and heating remains limited.
In transport, the IEA projects renewables’ share to rise modestly from 4% today to 6% in 2030, mostly through electric vehicles and biofuels. In heating, renewables are set to grow from 14% to 18% of global energy use over the same period.
These slower-moving sectors will define the next frontier of decarbonization — one where electrification, hydrogen, and new thermal storage technologies must play a greater role.
The Big Picture
Put together, the IEA’s forecasts and Ember’s real-world data signal that the clean energy transition has passed the point of no return.
Solar and wind are no longer simply catching up — they are now shaping global power dynamics. Their continued expansion is not only meeting new demand but beginning to displace fossil fuels outright.
“As costs of technologies continue to fall, now is the perfect moment to embrace the economic, social and health benefits that come with increased solar, wind and batteries,” said Ember’s Wiatros-Motyka.
Yet both agencies caution: to sustain this momentum, governments must expand grid capacity, diversify supply chains, and improve energy storage systems. Without these, the 2025 breakthrough could become a bottleneck.
A Symbol and a Signal
In a way, the world in 2025 looks a lot like Perinjanam did a few years ago — a place where optimism met obstacles, but the light won. What was once a village-scale transition is now a planetary transformation, proving that even small local models can foreshadow global change.
From Kerala’s rooftops to China’s vast solar parks, from India’s wind corridors to Africa’s mini-grids, the direction is unmistakable: the sun and wind are powering the next phase of human progress.
If 2024 was the year of warnings, 2025 is the year of evidence. The global energy system is finally tilting toward sustainability — not someday, but today.
Society
FIFA, ICC and F1 accused of greenwashing as Aramco sponsorships clash with climate goals
Human-rights and climate groups urge FIFA, F1, and ICC to cut Aramco sponsorships, warning deals clash with Paris climate goals.
Ten human-rights and climate groups have written to FIFA, Formula 1 and the ICC demanding they justify their multi-million-dollar sponsorship deals with Saudi Aramco, warning that the arrangements undermine both international climate targets and the sports’ own sustainability commitments.
The letters argue that accepting money from the world’s biggest oil producer while signing up to UN sport-for-climate initiatives exposes a glaring credibility gap. Aramco has repeatedly declared its intent to expand oil and gas production, a stance that campaigners say is fundamentally incompatible with rapid decarbonisation.
Frank Huisingh of Fossil Free Football said, in a statement, “FIFA and other sports bodies cannot claim to champion human rights or sustainability while they sell their platform to a big polluter — especially when that polluter uses our favourite sports to promote fossil fuels and stop the climate action we all need.”
Maryam Aldossari of ALQST warned, “Sports bodies that give Aramco a global audience are helping to strengthen the country’s harsh autocratic system, where criticism of the government is punishable by prison, and a journalist was executed earlier this year.”
New Zealand international Katie Rood added, “the leaders of sports like FIFA and Formula 1 claim that they care about the planet, but it’s impossible to reconcile these commitments with taking money from the largest oil and gas company in the world.”
Critics say Aramco’s growing sports sponsorships are part of a broader strategy to safeguard its status as the world’s largest oil and gas producer. The company has built a global sponsorship portfolio worth more than $1.3 billion across more than 900 agreements. In the coming years, its brand will take center stage as a “Major Worldwide Partner” for the 2026 and 2027 FIFA World Cups, while also serving as a lead sponsor of the 2026 T20 World Cup in India and Sri Lanka.
Sofie Junge Pedersen, Danish international with 88 caps said: “The choice to partner with Aramco helps the Saudi regime distract from its harmful treatment of women and the planet. Values are not just words to write on a page – you need to live them and stand by them. FIFA needs to stand by its set of values on human rights and sustainability, which they are not doing with this sponsorship.”
Wider context
The campaigners’ concerns build on a UN communication issued in August 2023, when Special Rapporteurs cautioned governments and financial institutions that their relationships with Aramco could breach international human-rights law. Although the sports bodies were not directly addressed, activists say the logic applies: by platforming Aramco, global sport risks complicity in the same climate-driven harms.
The controversy underlines sport’s climate credibility crisis. Global governing bodies have pledged to align with the Paris Agreement, but fossil-fuel sponsorships cut directly against those promises. The question now is whether commercial deals worth hundreds of millions outweigh the reputational cost of being seen as enablers of greenwashing.
Society
Big Fashion’s Fossil-Fuel Addiction: The Clean Heat Opportunity Being Ignored
Despite having a combined turnover of over $2.7 trillion, major fashion brands are lagging on electrification and renewable energy targets, risking both the environment and human rights.

The global fashion industry, worth a staggering $2.7 trillion, is still clinging to coal and other fossil fuels, putting both the planet and garment workers at risk, according to a damning new report by Fashion Revolution.
Fashion Revolution is a leading global movement advocating for a more ethical and sustainable fashion industry. With a presence in 76 countries, they unite citizens, industry leaders, and policymakers through groundbreaking research, education, and powerful advocacy, driving change from the ground up
The second edition of ‘What Fuels Fashion?’ reveals that despite glossy sustainability claims, most of the world’s biggest fashion brands are failing to tackle their most urgent climate responsibility: switching to clean heat.
‘Clean Heat’ is the use of renewables to meet manufacturing’s thermal energy demand, through solutions such as heat pumps and electric boilers
‘Clean Heat’ is the use of renewables to meet manufacturing’s thermal energy demand, through solutions such as heat pumps and electric boilers. This renewable, fossil-free energy could slash emissions from textile production while protecting workers from life-threatening heat stress.
The International Energy Agency warns that to achieve climate commitments, fashion brands need to help their supply chains shift entirely to electric and renewable energy by 2040. Meanwhile, a new study by the American Lung Association highlights the health and climate benefits of replacing fossil-fuelled industrial boilers with heat pumps.
Yet the report’s findings paint a bleak picture. Only 18% of brands have coal phase-out targets for textile processing, and none account for purchased steam — a major emissions source. A paltry 7% disclose any efforts to electrify high-heat processes, even though proven technologies exist, the report points out.
Read>> Why Kerala Has Struggled to Replicate Perinjanam’s Solar Success
90 brands scored zero on supply chain traceability, with many publicly listed — a glaring accountability gap for investors.
“Fashion brands love to promote innovative new products, but the Victorian-era reality of burning coal and wood to manufacture them is quietly swept under the rug,” said Ruth MacGilp, Fashion Campaign Manager at Action Speaks Louder.
The report also highlights a human cost often ignored in sustainability PR campaigns. As global temperatures rise, garment workers face increasingly unsafe factory conditions — yet not a single brand discloses factory-level heat and humidity data. “The path to decarbonisation will be won or lost by how fashion tackles heat,” warned Liv Simpliciano, Head of Policy & Research at Fashion Revolution.
Some high-profile names fared particularly badly. 39 major brands, including Forever 21, Reebok, Ted Baker, and Van Heusen, scored zero. At the top end, H&M (71%) and Puma (51%) led the rankings, but even leaders fell far short of full marks.
With fewer than a third of brands showing actual emissions reductions, and just 6% investing in renewable energy or efficiency, campaigners argue that fashion’s sustainability drive remains more marketing than meaningful change.
“The textiles industry has the chance to lead,” said Jan Rosenow, Professor of Energy and Climate Policy at Oxford University. “Process heat rarely exceeds 250°C — the technical barriers to moving away from fossil fuels are low. Companies must commit now.”
The report concludes with a blunt warning: unless brands embrace clean heat, they will continue to fuel climate breakdown while exposing workers to unsafe conditions — a toxic combination that could unravel fashion’s future far faster than fleeting trends ever could.


The Data Don’t Lie: Women Are Still Missing from Science — But Why?

Global Report Reveals Planetary Health Communication Crisis Fuelled by AI and Misinformation

MIT Engineers’ Discovery Could Supercharge Hydrogen Economy

Bridging the Adaptation Finance Gap: India’s Case Before COP30

The Dragon and the Elephant Dance for a Cleaner World

The Next Green Revolution Is Being Built on China’s Terms

Most Earthquake Energy Is Spent Heating Up Rocks, Not Shaking the Ground: New MIT Study Finds

Why Kerala Has Struggled to Replicate Perinjanam’s Solar Success

Study Suggests Primordial Black Hole Explosions May Explain Highest-Energy Neutrino Detected

The Tiny Grip That Could Reshape Medicine: India’s Dual-Trap Optical Tweezer

-

 Space & Physics5 months ago
Is Time Travel Possible? Exploring the Science Behind the Concept
-

 Earth6 months ago
122 Forests, 3.2 Million Trees: How One Man Built the World’s Largest Miyawaki Forest
-

 Space & Physics6 months ago
Did JWST detect “signs of life” in an alien planet?
-

 Know The Scientist5 months ago
Narlikar – the rare Indian scientist who penned short stories
-

 Society4 months ago
Shukla is now India’s first astronaut in decades to visit outer space
-

 Society4 months ago
Axiom-4 will see an Indian astronaut depart for outer space after 41 years
-

 Earth4 months ago
World Environment Day 2025: “Beating plastic pollution”
-

 Society6 months ago
Rabies, Bites, and Policy Gaps: One Woman’s Humane Fight for Kerala’s Stray Dogs